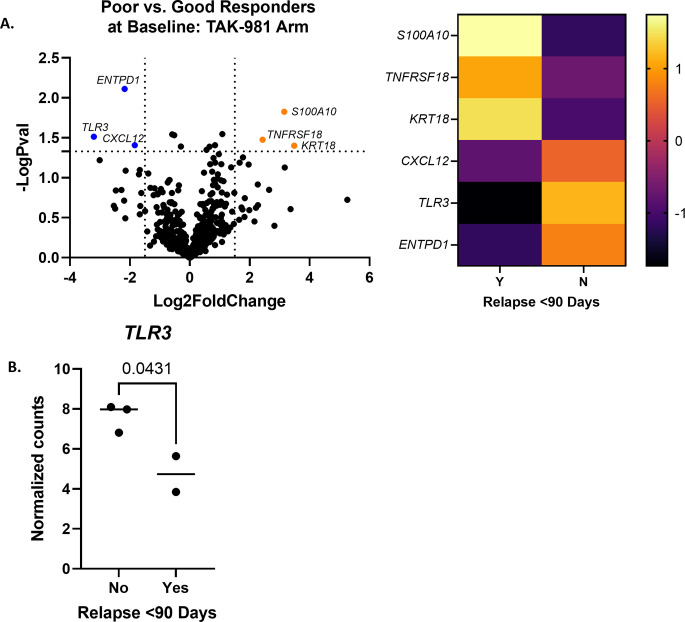
Fig 4. TAK-981 arm differential gene expression between poor and good responders at baseline.
(A) Differentially expressed genes in poor responders as compared to good responders (n = 2 poor and 3 good responders; log2fold change < or > 1.5 and p<0.05.) A heatmap was made with the same significance criteria. (B) Normalized gene counts for TLR3 were significantly higher at baseline in good responders (p = 0.0431 with unpaired t test).

