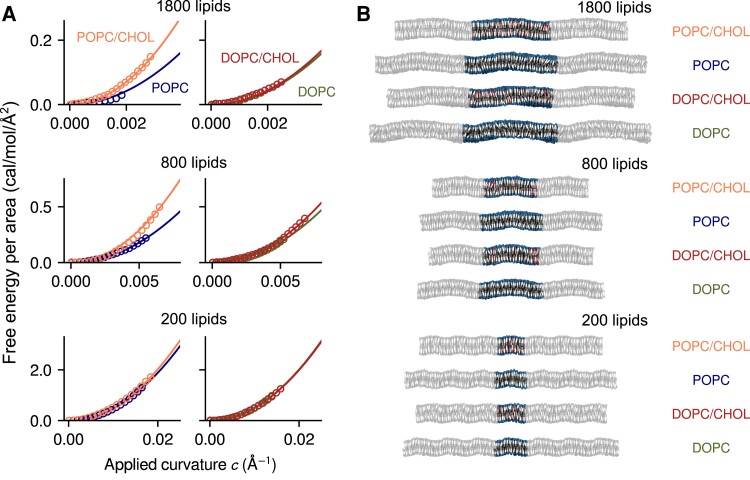
Fig. 2.
Direct calculation of the free-energy cost of lipid bilayer bending using the Multi-Map enhanced-sampling simulation method. A) Potentials-of-mean-force (PMFs) as a function of the applied bilayer curvature c for an applied sinusoidal shape along the x-axis; using c as abscissa facilitates direct comparisons between bilayers of different sizes (in contrast to e.g. the peak amplitude of the deformation (26)). Data are shown for POPC, POPC/CHOL, DOPC, and DOPC/CHOL bilayers, containing either 1800, 800 or 200 lipid molecules (as indicated). All PMF profiles are given in units of free-energy per area; symbols indicate computed values and solid lines are quadratic fits assuming , where the fit error on B is ≤0.2 kcal/mol. B) Representative snapshots of each bilayer, represented in Fig. 1. The figure highlights the periodic unit cell, flanked by its images along the direction of the sinusoid.

