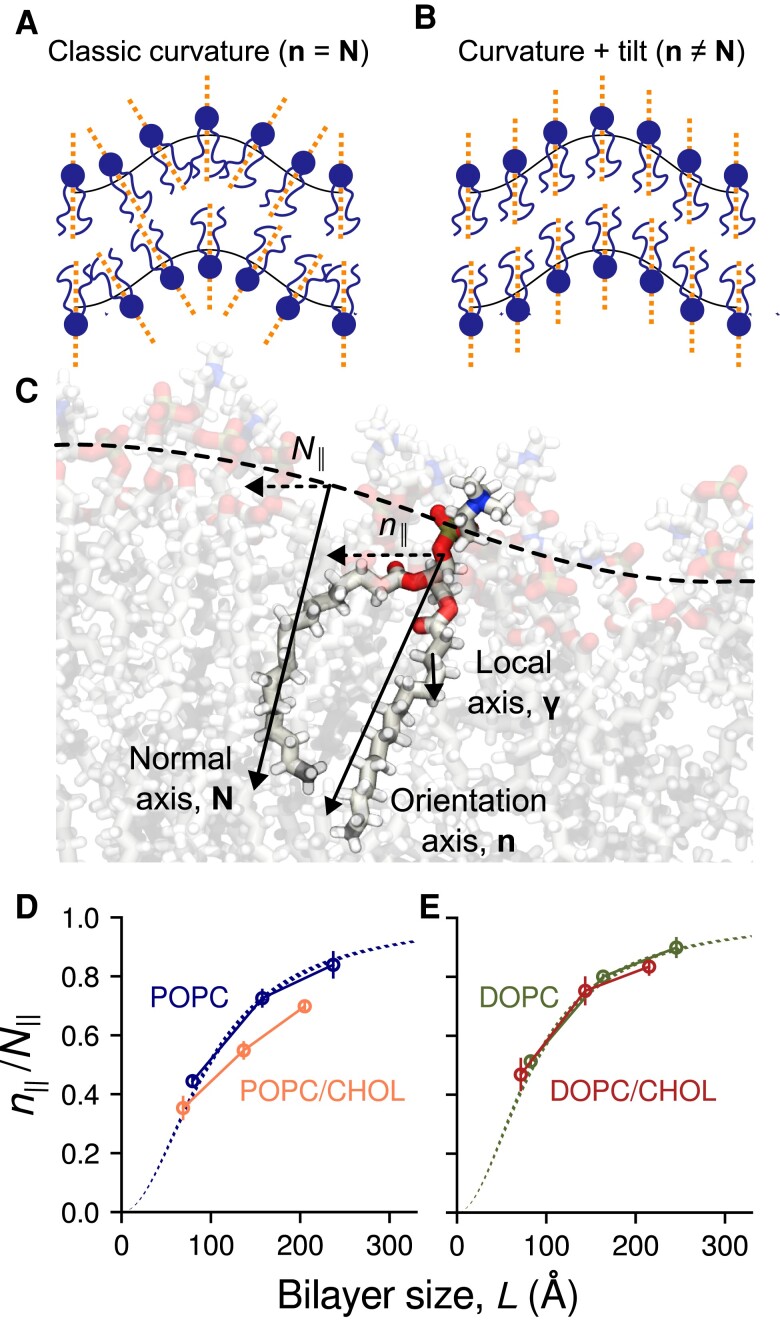
Fig. 3.
Membrane bending entails midplane curvature and lipid tilt. A,B) Schematic of an idealized curved bilayer wherein one or other term of Eq. 2 (32) dominates the energetics. C) Illustration of the membrane normal vector, , the lipid orientation vector (or lipid director), , and the local chain vector , analyzed in Fig. 6. The ratio measures the degree to which midplane curvature defines the bending energetics; = 1 only in the “macroscopic” limit, where the Helfrich–Canham model is valid. D,E) Mean values of for POPC, POPC/CHOL, DOPC and DOPC/CHOL, calculated from the same MD trajectories used to derive the PMF profiles in Fig. 2. Error bars represent standard errors. Dashed lines show the theoretical predictions for DOPC and POPC using Eq. 3 and published values of (27).

