Fig. 5.
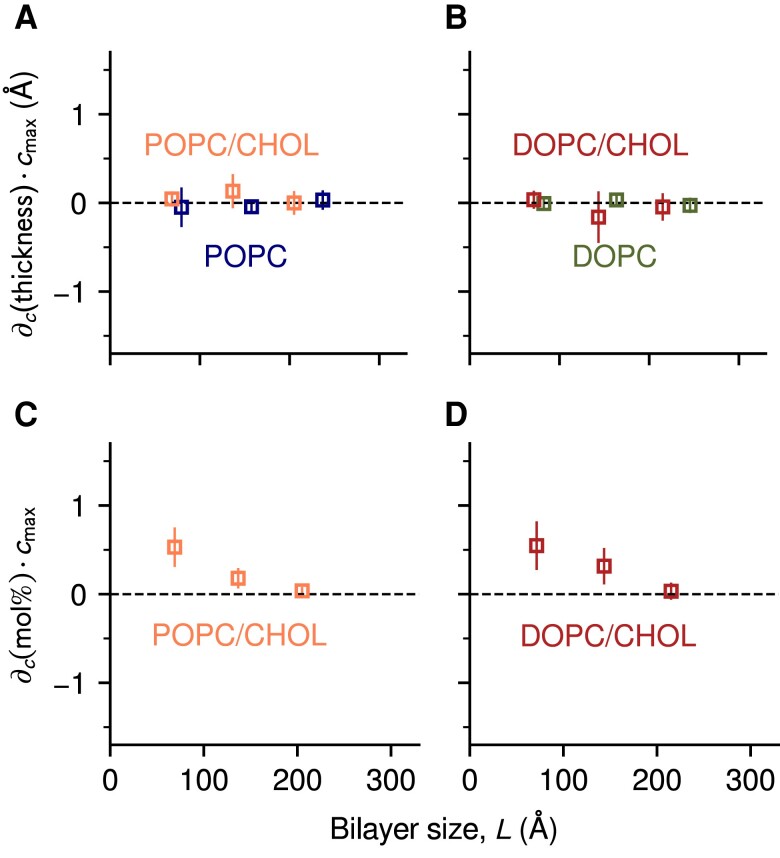
Differential stiffening effect is not explained by curvature-induced variations in bilayer thickness or local cholesterol enrichment. A,B) Derivatives of the thickness with respect to curvature for different bilayers of A) POPC and POPC/CHOL, or B) DOPC and DOPC/CHOL. The derivatives were estimated by linear regression of the thickness map against the curvature map of the midplane, . C,D) Derivatives of the cholesterol concentration with respect to curvature for different bilayers of C) POPC/CHOL and DOPC/CHOL, estimated by linear regression of the 2D histograms of cholesterol on each leaflet against and , respectively. For ease of comparison, the resulting slopes were multiplied by the largest applied curvature ; error bars represent standard errors.

