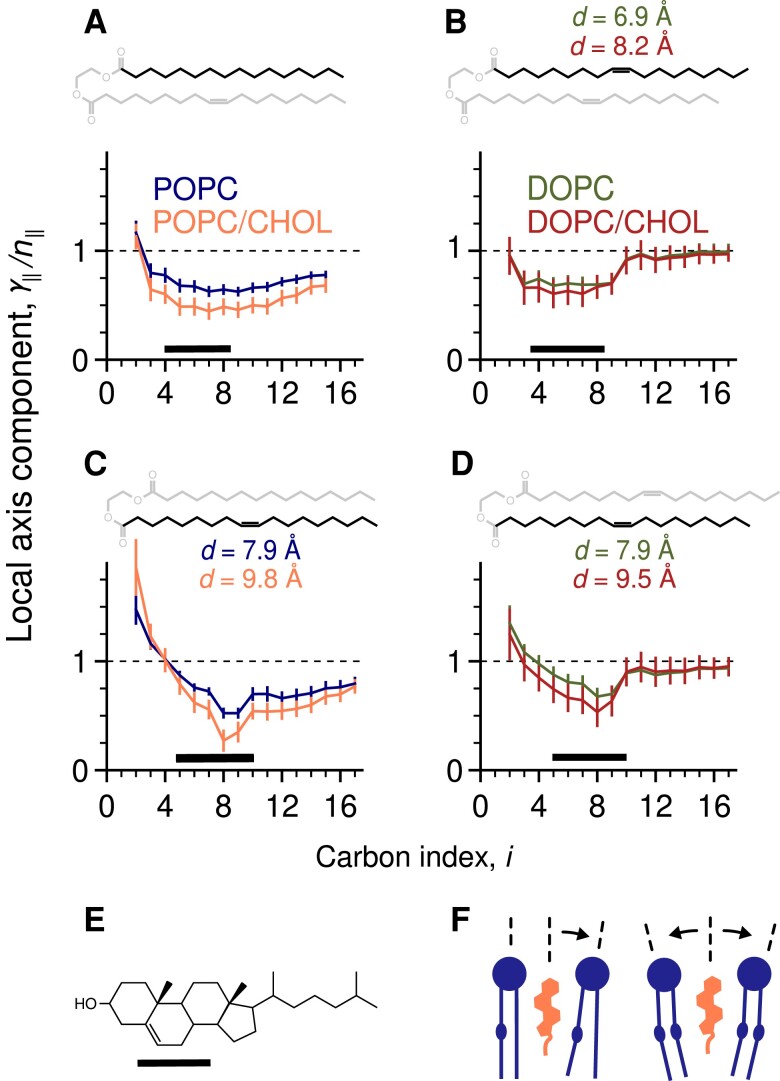
Fig. 6.
Location of unsaturated bonds relative to cholesterol explains lack of stiffening effect on DOPC. Shown are mean values, computed over independent simulations of curved 200-lipid bilayers, of the ratio between the longitudinal components of the local chain axis orientation vector, , and of the lipid orientation vector ; error bars are standard deviations. A) Values for the sn-1 chains in POPC and POPC/CHOL bilayers, and B) in DOPC and DOPC/CHOL bilayers. C,D) Equivalent results for the sn-2 chains in the same bilayers. Above each panel, the chemical structure of the acyl chain is highlighted, with text labels reporting the mean distance d of each unsaturated bond from the midplane (standard deviations are 5 Å). Thick horizontal bars indicate the central 50% of the density of the sterol group, also drawn in E) for reference. F) Illustration showing how ordered saturated chains hinder curvature generation compared to ordered unsaturated chains; dashed lines indicate the lipid orientation vector .

