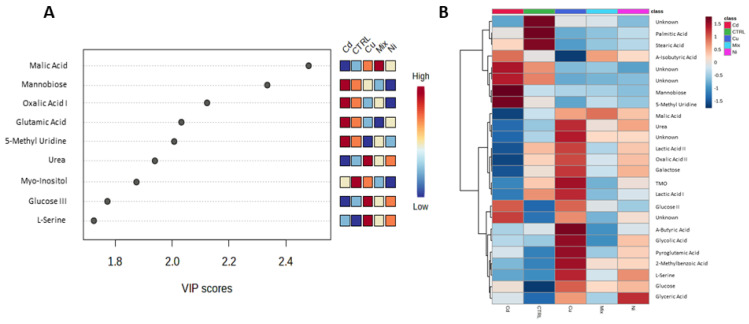
Figure 2.
(A) Metabolites relevant to class separation (VIP score > 1.5). (B) Heatmap displaying the metabolites’ selected by ANOVA concentrations. The utilisation of cluster analysis facilitated the identification of four distinct clusters of metabolites, determined by their average concentration levels within the five classes.

