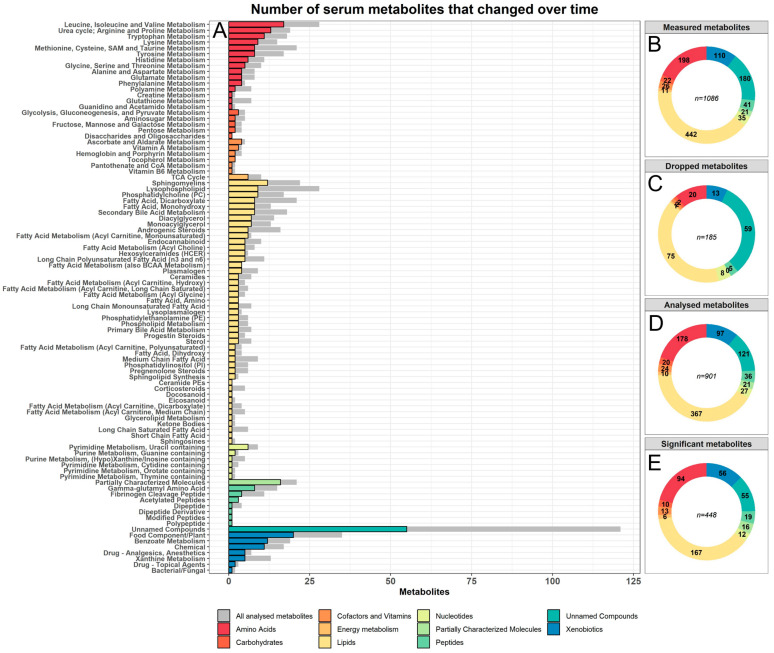
Figure 1.
Distributions of serum metabolites by biochemical family. (A) Overview of the number of significantly and consistently changed metabolites per pathway in the first eight days after hospitalisation. Each pathway was coloured and sorted by their biochemical family. The grey bars represent the total number of metabolites analysed in each pathway. Panel (B–E) show the distributions of metabolites per biochemical family, respectively, for all measured metabolites, all removed metabolites, all analysed metabolites, and all significant and consistently changed metabolites.

