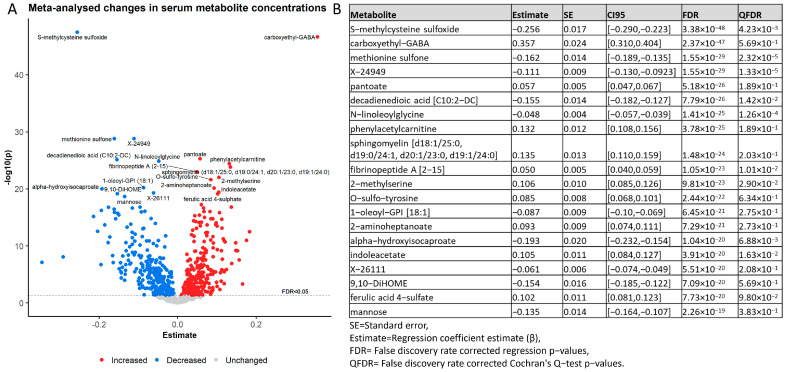
Figure 2.
Overview of the top 20 most significantly changed serum metabolites. (A) Volcano plot of regression outcomes for all 901 analysed metabolites with the regression estimate on the x-axis against the −log10 transformed p-value on the y-axis. The red and blue dots represent all increased and decreased metabolites, respectively. The top 20 most-changed metabolites are labelled. (B) Summary of the regression results for the top 20 metabolites with the lowest FDR corrected p-values. In addition to the metabolite names, the standard errors (SE), the regression coefficient estimates (Estimate), and the 95% confidence intervals (CI95) are displayed. The FDR corrected p-values from the regression models are shown as FDR. The QFDR values represent the FDR corrected p-values obtained from the Cochran’s Q-test for quantifying the between-cohort heterogeneity.

