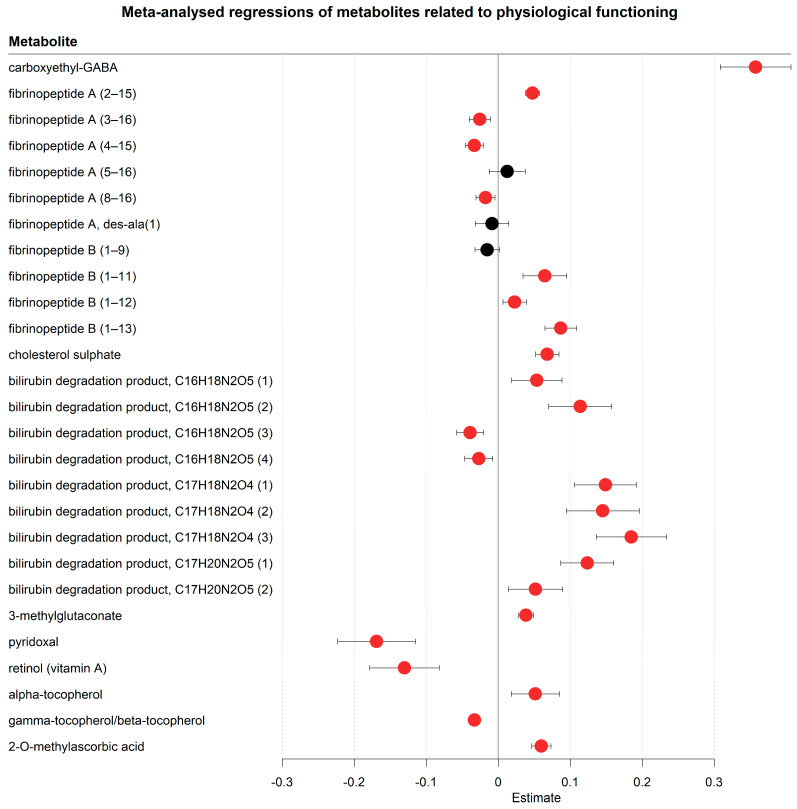
Figure 7.
Meta-analysed regression outcomes of serum metabolites related to physiological functioning. Forest plot of meta-analysed compounds related to physiological functioning. The estimates, or regression coefficients, represent the pooled change in concentration over time in the three cohorts (see Section 4 for details). Negative estimates indicate decreased serum concentrations, while positive estimates indicate increased serum concentrations during hospitalisation. The displayed metabolites all changed consistently and homogenously between cohorts. Metabolites with red-coloured estimates remained significantly changed after correction for the false discovery rate. Black-coloured estimates indicate no significant change after multiple testing correction. The 95% confidence interval is given by the protruding lines from the metabolite estimate.

