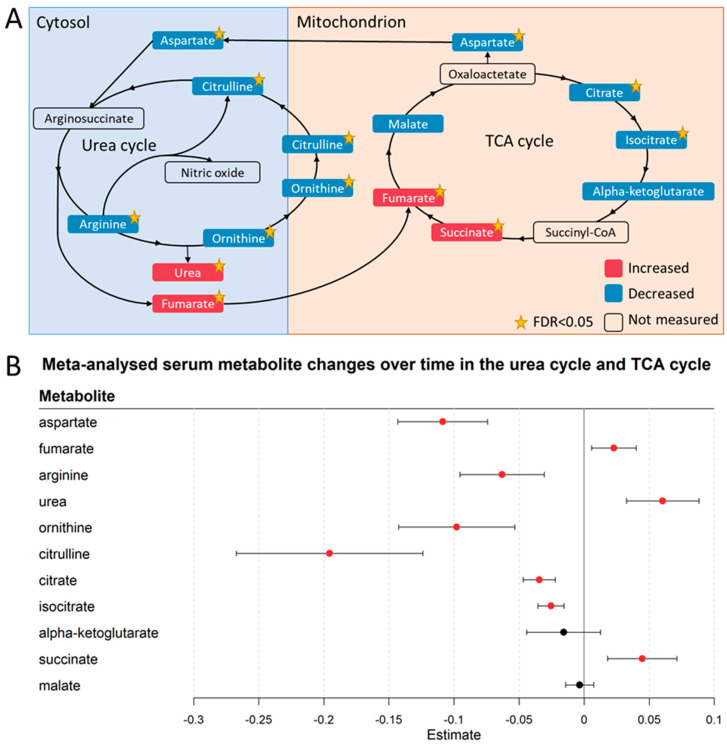
Figure 9.
Metabolic reprogramming in the urea cycle and the TCA cycle. (A) Serum metabolic changes of the urea cycle metabolites and TCA cycle metabolites. Metabolites in red were increased in the serum after one week, whereas metabolites in blue were decreased. The yellow star indicates if the change was significant (FDR < 0.05) over time. All displayed metabolites were consistently changed across the three locations. (B) Forest plot of meta-analysed regression outcomes of the visualised urea cycle and TCA cycle metabolites in Figure 2A. The estimates, or regression coefficients, represent the pooled change in concentration over time in the three cohorts (see Section 4 for details). Negative estimates indicate decreased serum concentrations, while positive estimates indicate increased serum concentrations during hospitalisation. The displayed metabolites all changed consistently and homogenously between cohorts. Metabolites with red-coloured estimates remained significantly changed after correction for the false discovery rate. Black-coloured estimates indicate no significant change after multiple testing correction. The 95% confidence interval is given by the protruding lines from the metabolite estimate.

