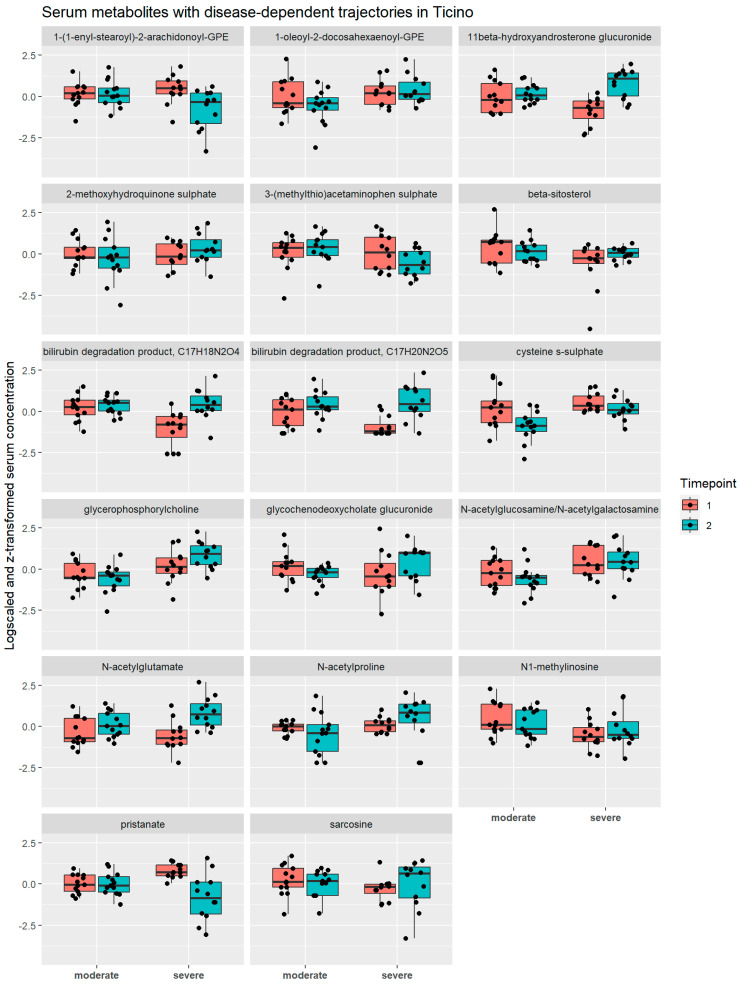
Figure 10.
Overview of serum concentrations of metabolites with disease-dependent trajectories in the Ticino cohort. Boxplots of the log-transformed concentrations of metabolites with different serum trajectories in moderate and severe patients in Ticino. In each tile, comparisons are made between the first (salmon red) and second (turquoise) timepoint for the moderate cases (left two boxplots) and severe cases (right two boxplots). The black dots represent the individual concentration values.

