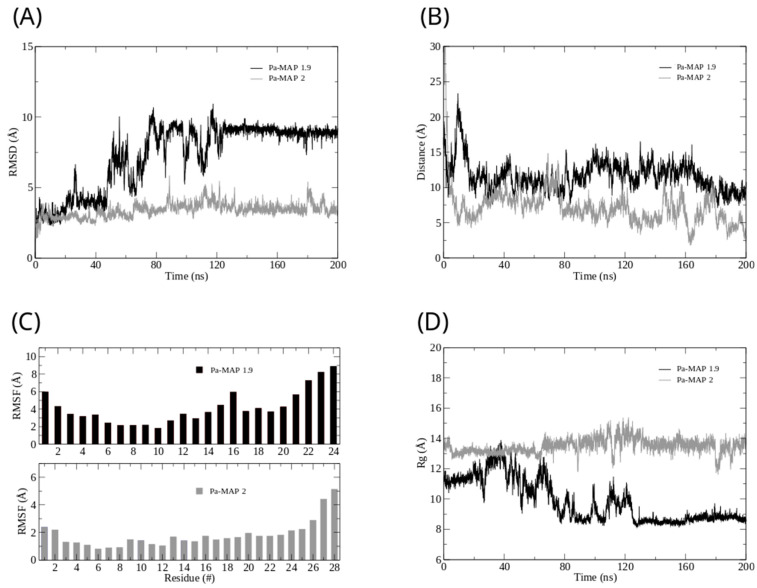
Figure 2.
Root mean square deviation (A) for Pa-MAP1.9 (black) and Pa-MAP2 (gray). (B) Distance from the center of mass of Pa-MAP1.9 (black) and Pa-MAP2 (gray) during the simulation. (C) Root mean square fluctuation by residues of the peptides during MD. (D) Radius of gyration for Pa-MAP1.9 (black) and Pa-MAP2 (gray) during 200 ns of the simulation.

