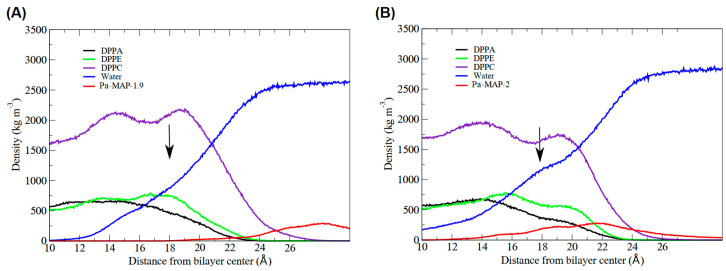
Figure 5.
Highlight of the interface region of the mass density profile for the peptides. The black arrow points where, for (A) Pa-MAP1.9 and (B) Pa-MAP2, the water density slightly increased, forming a shoulder-like, indicating permeabilization on the bilayer surface. The red curve shows the density of the peptides (approximation) in relation to the membrane.

