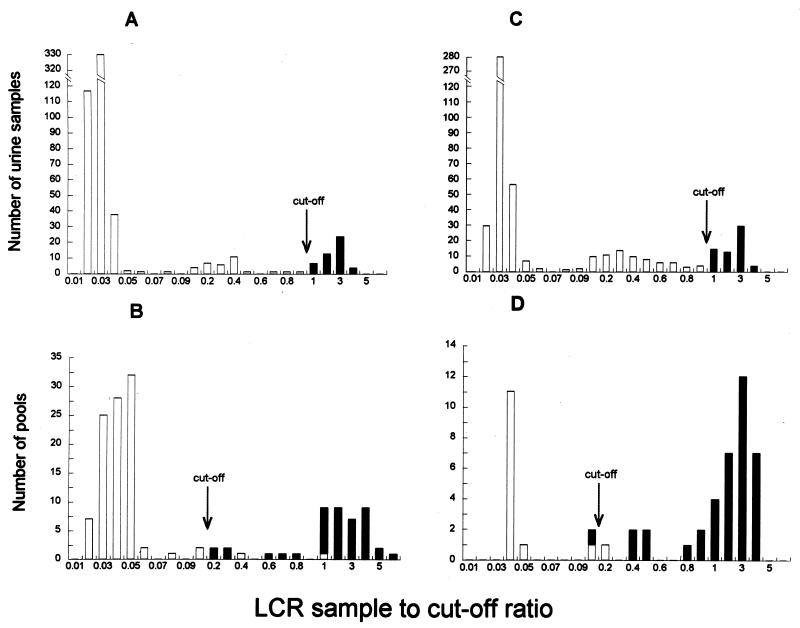
FIG. 1.
Detection of genital C. trachomatis infection by LCR. Graphs A and C show the distribution of individual urine samples from two groups of 568 and 520 women taken from the study population. Graph B shows the distribution of the samples in A pooled by 4 (n = 142), and graph D shows the distribution of the samples in C pooled by 10 (n = 52). The S/CO for individual samples, which was 1.0, was lowered to 0.2 for pooled samples, as indicated.

