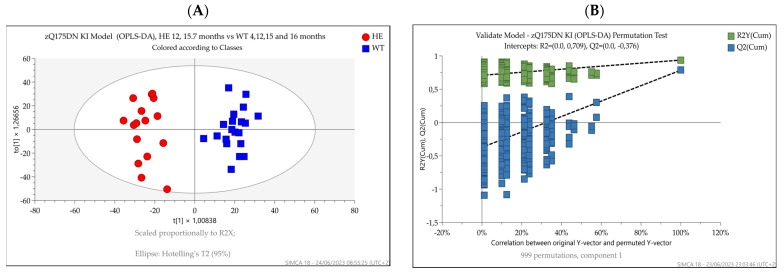
Figure 7.
(A) OPLS-DA score plots display separation between 12- and 15.7-month-old zQ175DN mice (red circles) and 4-, 12-, and 15.7-month-old wild-type mice (blue squares). R2Y and Q2X were 0.94 and 0.78, respectively. Since only two samples were representing the knock-in mice at four months, they were excluded from the dataset. (B) Permutation test showing the goodness of fit of the model built.

