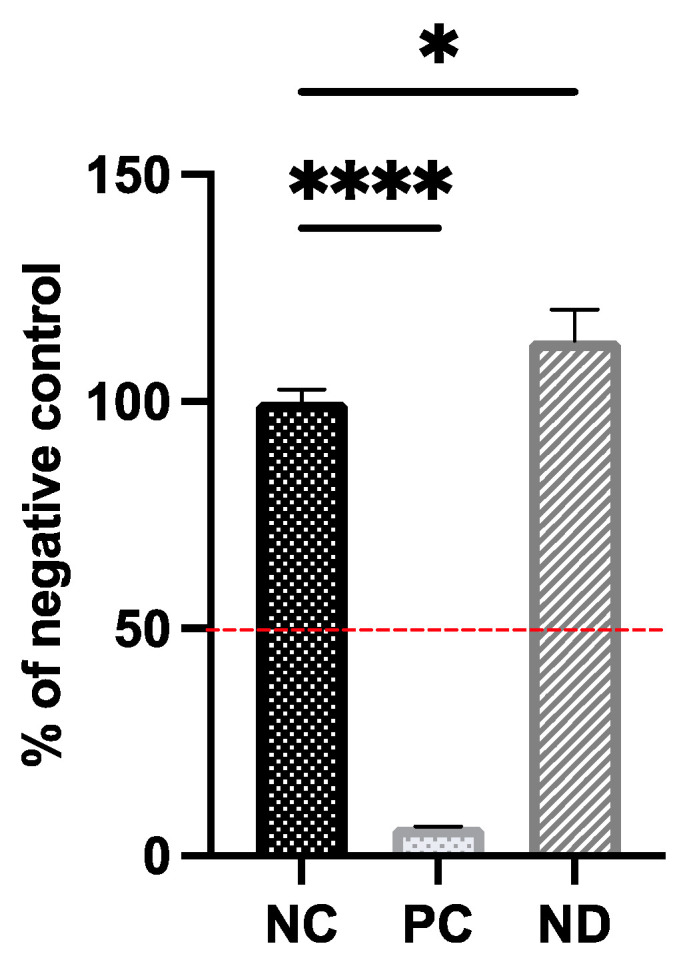
Figure 2.

EpiDermTM viability evaluated by the MTT assay. The dashed red line indicates the critical point at 50% viability, indicating irritant potential. Mean ± standard deviation values are presented. Statistical significance between control and treated cells is indicated by an asterisk, evaluated using Tukey’s multiple comparison test (p < 0.05). Asterisk (*) represents p < 0.01, and four asterisks (****) represent p < 0.0001. Abbreviations: NC, negative control (DPBS treated); PC, positive control (1% SDS treated); ND, tissues treated with 25 μg/mL nanodiamond.
