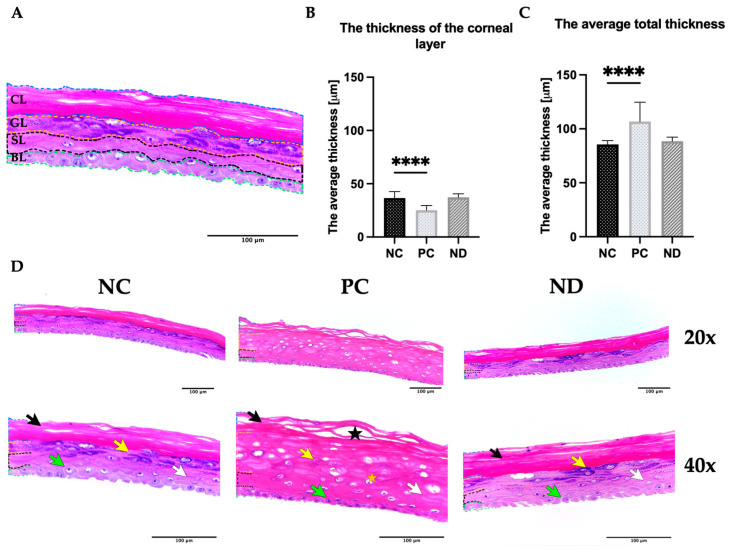
Figure 3.
Histological examination of EpiDermTM. (A) Scheme of tissue structure. With a dotted line, the individual layers are indicated as follows: blue—corneal layer (CL), yellow—granular layer (GL), black—spinous layer (SL), green—basal layer (BL); (B) average thickness of the stratum corneum layer; (C) overall thickness; (D) tissue visualization after hematoxylin-eosin staining at magnifications: 20× and 40×. The loosely arranged cells of stratum corneum are indicated as black arrows, lamellar bodies with keratohyalin granules are labeled as a yellow arrows, flattened cells of the spinous layer are pointed out with white arrows, the basal layer cells with a columnar shape with rounded contours are a green arrows. The tissue damage is indicated by a black star, and the orange star represents the presence of necrotic processes. Values are displayed as mean ± SD. Significant differences between control and treated cells are indicated with a p-value < 0.05, where **** denotes a p-value < 0.0001. Abbreviations: NC, negative control (DPBS treated); PC, positive control (1% SDS treated); ND, tissues exposed to nanodiamond at 25 μg/mL.

