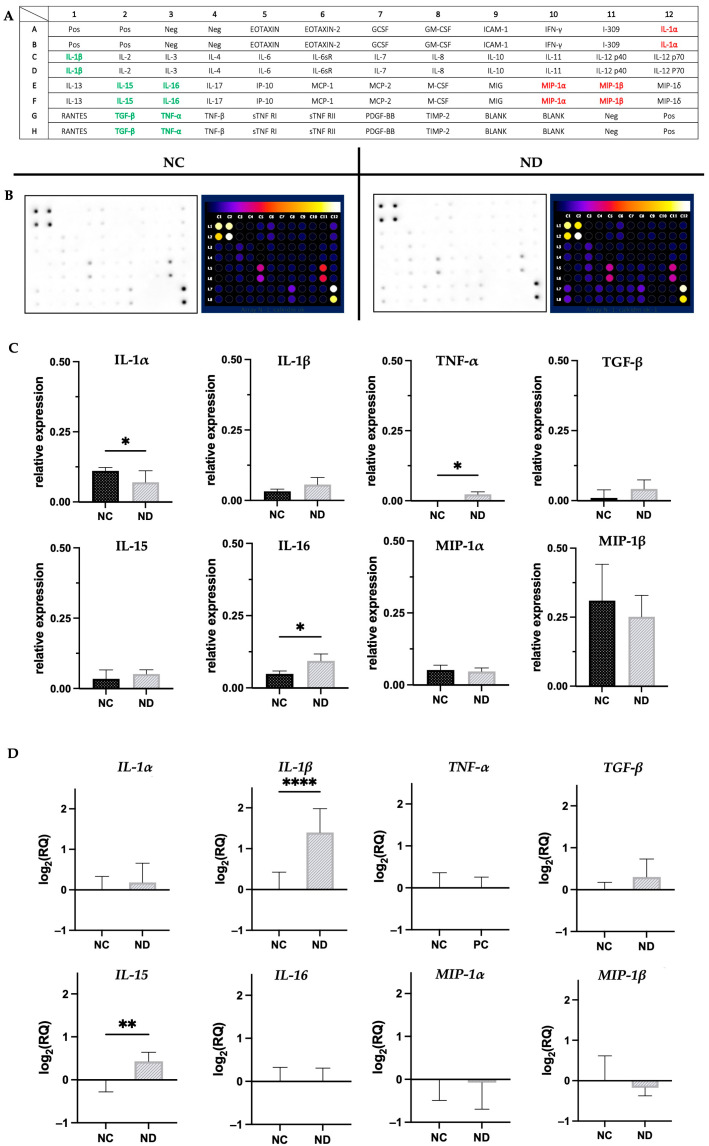
Figure 4.
Proinflammatory cytokines expression. (A) Scheme of the protein pattern at the membranes. Proteins that showed an increase in expression after ND treatment are marked in green, whereas those exhibiting a decrease in expression are marked in red; (B) levels of cytokines after normalization; (C) the relative expression levels of selected proteins; (D) and their corresponding genes. Mean ± standard deviation values are presented. Statistically significant differences between control and treated cells are indicated by an asterisk, evaluated using Student’s t-test (p < 0.05). Asterisk (*) represents p < 0.01, (**) p < 0.05, while four asterisks (****) represent p < 0.0001. Abbreviations: NC, negative control (DPBS treated); ND, tissues exposed to nanodiamond at a concentration of 25 μg/mL; IL-1α, Interleukin-1 alpha; IL-1β, Interleukin-1 beta; TNF-α, Tumor necrosis factor; TGF-β, Transforming growth factor beta; IL-15, Interleukin-15; IL-16, Interleukin-16; MIP-1α, Macrophage inflammatory protein-1 alpha; MIP-1β, Macrophage inflammatory protein-1 beta.

