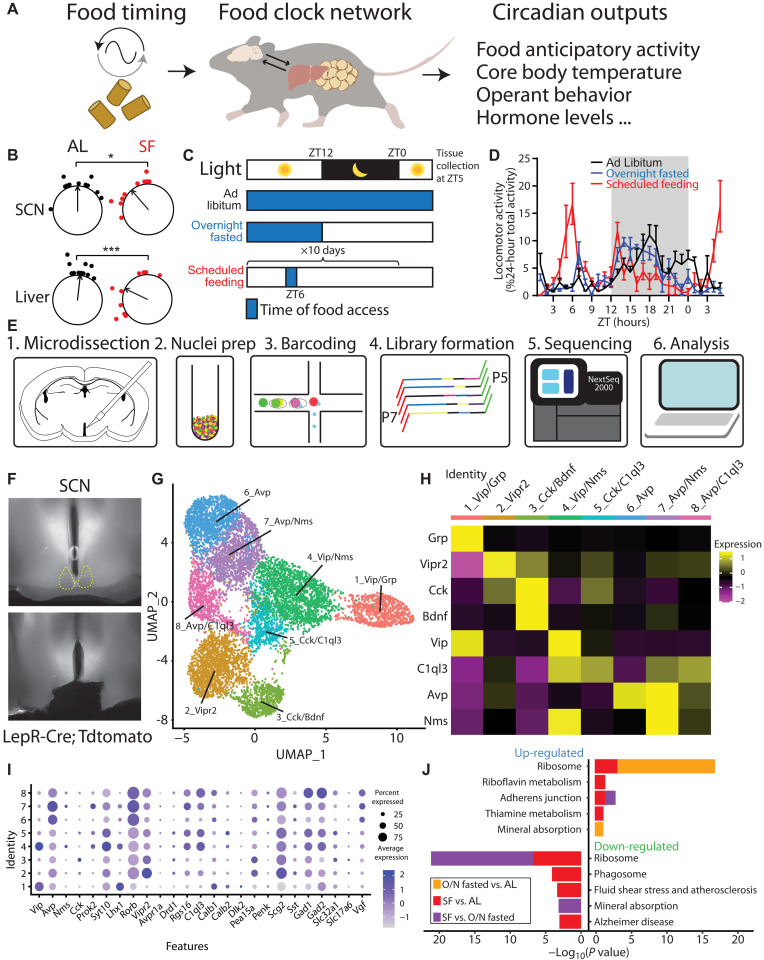
Fig. 1. SCN snRNA-seq reveals minimal alteration of circadian genes during SF.
(A) Diagram illustrating that food timing as a potent zeitgeber entraining an oscillatory network system in the brain and peripheral organs, relaying rhythmic behavior outputs. (B) The ZT phase of the first bioluminescence peak of SCN and liver from PER2::Luciferase (PER2LUC) mice that are either provided with scheduled food access for 4 days at ZT6 or ad libitum (AL) fed controls (untreated or given ZT6 saline injections). Phases of sample points are shown relative to the normalized mean phase of control SCN. Two-way analysis of variance (ANOVA) with Bonferroni post hoc comparison; n = 10 to 11 per group; Ftreatment(1,38) = 19.05, P < 0.001. (C) Schematic of experimental design. Mice were housed on a 12:12-hour light/dark (LD) cycle and either fed ad libitum, overnight (O/N) fasted, or provided a scheduled meal for 10 days at ZT6. Blue shading denotes food access. Mice were euthanized for tissue collection at ZT5. (D) Normalized locomotor activity starting 29 hours before tissue collection. n = 4 mice per condition. Data are represented as means ± SEM. (E) Schematic of single-nucleus RNA sequencing (snRNA-seq) workflow using 10× Genomics. (F) Representative images illustrating the area of dissection in the SCN for snRNA-seq. (G) Uniform Manifold Approximation and Projection (UMAP) plot of eight molecularly distinct SCN neuron subtypes (n = 8957 neurons). (H) Heatmap of cluster-average marker gene expression, scaled by gene. (I) Dot plot of average expression level (dot color) and percent expression (dot size) for each SCN neuron cluster. Genes shown are previously defined as SCN markers (35, 36) and validated on the basis of Allen Brain Atlas Mouse Brain in situ hybridization data (57). (J) Gene enrichment analysis comparing top five pathways up- and down-regulated among feeding conditions in all SCN neurons, using KEGG Mouse 2019 database.

