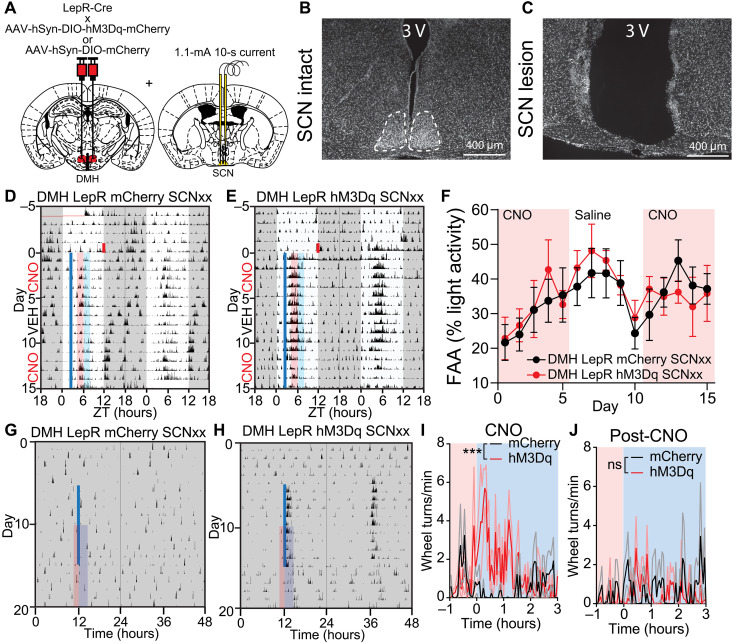
Fig. 10. SCN is required for DMHLepR neurons to alter circadian behaviors.
(A) Schematic diagram illustrating bilateral injection of AAV-hSyn-DIO-hM3Dq-mCherry or AAV-hSyn-DIO-mCherry to the DMH of LepR-Cre mice coupled with electrolytic lesioning of the SCN in the same mice. (B and C) Representative 4′,6-diamidino-2-phenylindole (DAPI) staining images of (B) intact and (C) electrolytic lesioned SCN. (D and E) Representative actograms of SCN lesioned (D) DMHLepR mCherry and (E) DMHLepR hM3Dq mice on SF that received CNO (0.3 mg/kg; SF days 1 to 5), saline (SF days 6 to 10), and CNO (0.3 mg/kg; SF days 11 to 15) injection at ZT2.5. Shading color scheme is described in Fig. 3C. See fig. S13 (D and E) for actograms of all animals. (F) Quantification of FAA. Pink-shaded areas indicate days with CNO injection. No shading indicates saline injection. Repeated-measures two-way ANOVA with Bonferroni post hoc comparison; n = 6 to 7 per group; Fvirus(1,11) = 0.07566, P = 0.7884; Fvirus * time(14,154) = 0.4633, P = 0.9491. (G and H) Representative actograms of an SCN-lesioned (G) DMHLepR mCherry and (H) DMHLepR hM3Dq animal injected with CNO every 24 hours for 10 days in DD. Solid blue line indicates CNO injection. See fig. S13 (F and G) for actograms of all animals. (I) Average wheel running activity induced by chemogenetic activation of DMHLepR neurons from (G) and (H). Color-coded time window is indicated in (G) and (H). Repeated-measures two-way ANOVA; n = 5 to 6 per group; Fvirus(1, 9) = 8.245, P = 0.0184; Fvirust * time(79,711) = 2.432, P < 0.0001. (J) Quantification of activity for 5 days after cessation of CNO injections from (G) and (H). Repeated-measures two-way ANOVA; n = 5 to 6 per group; Fvirus(1,9) = 0.3450, P = 0.5714; Fvirus * time(79,711) = 1.047, P = 0.3746. Data are represented as means ± SEM. ***P < 0.001; ns, not significant.

