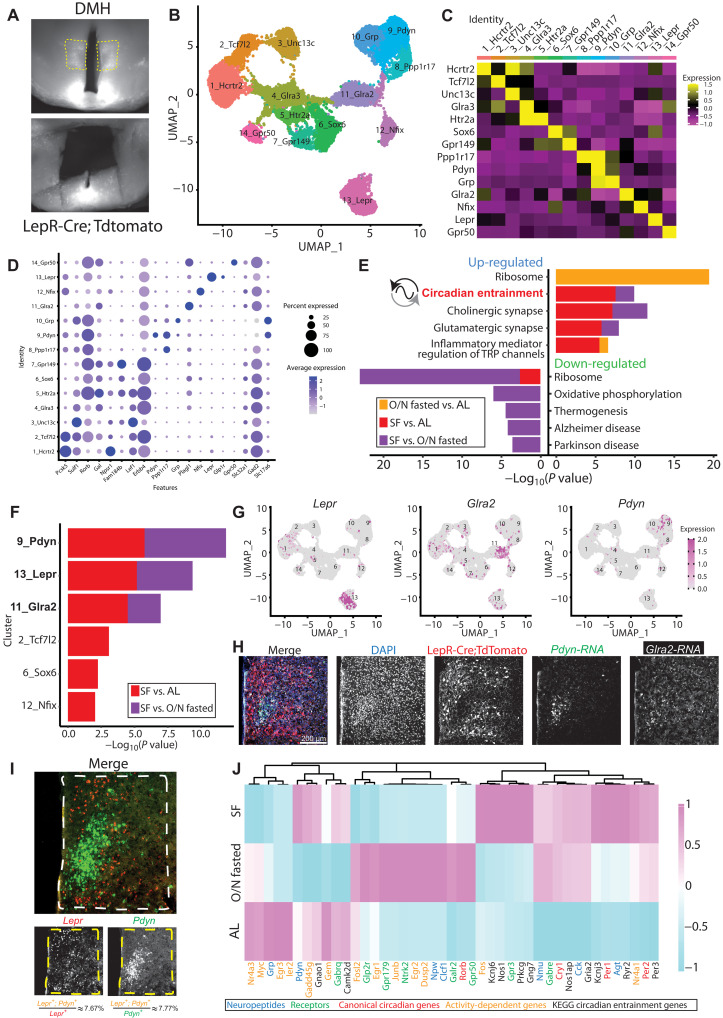
Fig. 2. SF alters circadian entrainment genes in specific DMH neuron subtypes.
(A) Representative images illustrating the DMH area dissected for snRNA-seq. (B) UMAP of 14 defined DMH neuron subtypes (n = 16,281 neurons). (C) Average gene expression heatmap labeled by cluster-specific markers in the DMH. (D) Dot plot of average expression level (dot color) and percent expression (dot size) of genes of interest within DMH clusters. These genes were either previously identified in DMH (44, 50, 51, 104) or validated as DMH markers by the Allen Brain Atlas Mouse Brain in situ hybridization data (57). (E) Gene enrichment analysis comparing top five pathways up- and down-regulated across feeding conditions in all DMH neurons, using KEGG Mouse 2019 database. Inclusion criteria required P < 0.05 and log2 fold change > 0.25. (F) DMH clusters with differentially regulated circadian entrainment pathways in at least one SF comparison. (G) Feature plots indicating spatial expression of Lepr (left), Glra2 (middle), and Pdyn (right), in DMH clusters. (H) Representative coronal section image localizing expression of LepR, Pdyn, and Glra2 in the DMH. LepR cells were marked by LepR-Cre;TdTomato protein, whereas Pdyn and Glra2 transcripts were visualized by RNA FISH. See also fig. S4F for zoomed-out view of the same brain section. (I) Representative RNA FISH coronal section image showing Lepr and Pdyn transcripts in the DMH. Quantification of Lepr and Pdyn coexpressing cells is depicted at the bottom. n = 3 mice. (J) Heatmap of select genes that were differentially expressed across feeding conditions in DMHLepR neurons. TRP, transient receptor potential.

