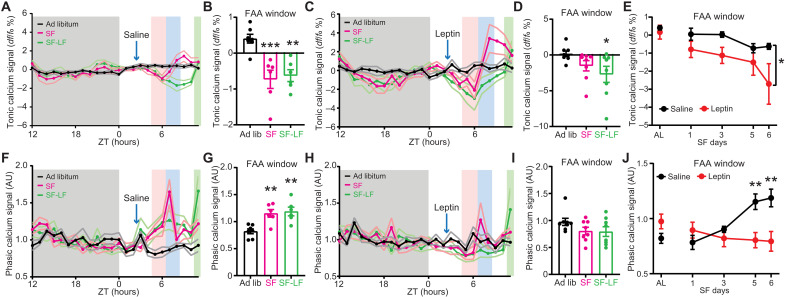
Fig. 4. DMHLepR neurons exhibit food entrainable calcium activity patterns which correlate with FAA.
(A) Average tonic calcium signal of DMHLepR neurons from saline control group 2 days before SF (black, ad libitum), 5th day during treatment (magenta, SF), and 6th day where saline injection was withheld and food was delayed for 3.5 hours (green, SF-LF). Shading color scheme is described in Fig. 3C. (B) Tonic calcium signal from saline treated mice in the FAA window (average of ZT5 to ZT6) from (A). n = 6 to 7 per group; F(2,16) = 12.27, P = 0.0006. (C) Average tonic calcium signal of DMHLepR neurons from leptin-treated group. (D) Tonic calcium signal from leptin treated mice in the FAA window from (C). n = 8 per group; F(2,14) = 3.596, P = 0.0549. (E) Development of tonic calcium signal during FAA. n = 6 to 8 per group; Ftreatment(1,13) = 4.744, P = 0.0484. (F) Average phasic calcium signal of DMHLepR neurons from saline control group. Normalized to average dark phase signal (ZT12 to ZT0). AU, arbitrary units. (G) Phasic calcium signal from saline-treated mice in the FAA window from (F). n = 6 to 7 per group; F(2,10) = 15.01, P = 0.0010. (H) Average phasic calcium signal of DMHLepR neurons from leptin group. Normalized to average dark phase signal (ZT12 to ZT0). (I) Phasic calcium signal from leptin treated mice in the FAA window from (H). n = 8 per group; F(2,14) = 2.508, P = 0.1172. (J) Development of phasic calcium signal during FAA. n = 6 to 8 per group; Ftreatment * time(4,50) = 8.834, P < 0.0001. Data are represented as means ± SEM. *P < 0.05; **P < 0.01; ***P < 0.001. (B, E, G, and J) Mixed-effects (REML) analysis with Bonferroni post hoc comparison; (D and I) repeated-measures one-way ANOVA with Bonferroni post hoc comparison.

