
Extended Data Fig. 1. The average performance of various models over 34 datasets.
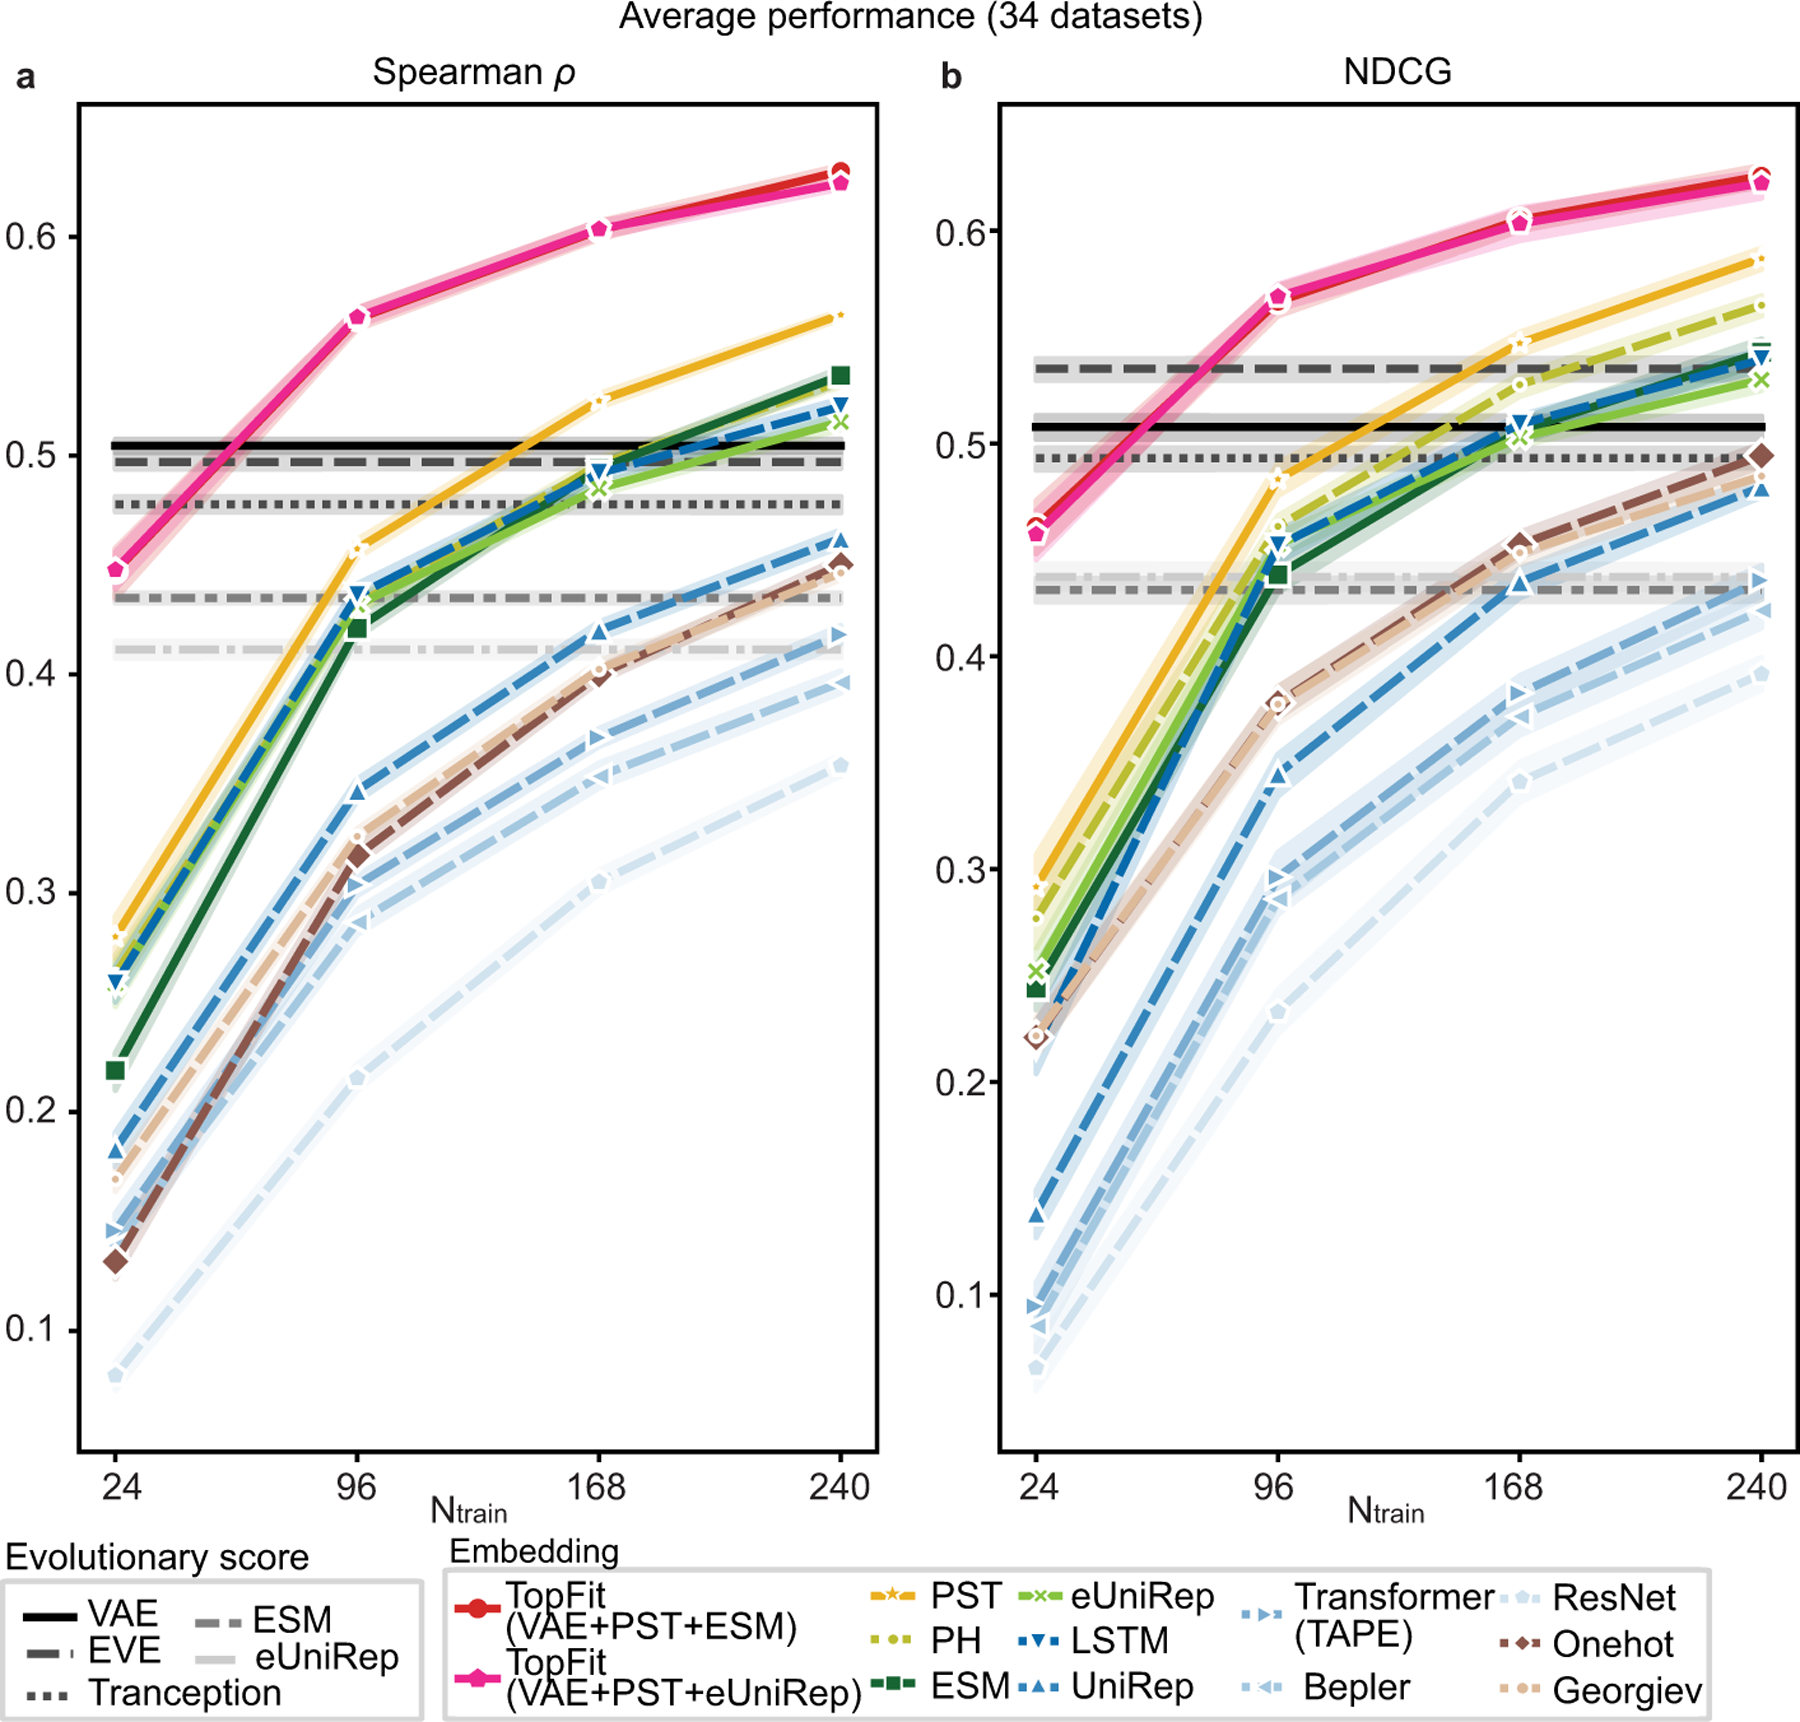
This is a supplement for Figure 3a. (a). Line plots show identical data with Figure 3a with additional data for two TopFit strategies. (b). Results are evaluated by NDCG. In (a-b), ensemble regression is used, except ridge regression for Georgiev and one-hot embeddings. Absolute values of ρ were shown for evolutionary scores. The width of shade shows 95% confidence interval from n = 20 repeats. Evolutionary scores use absolute values for corresponding quantities.