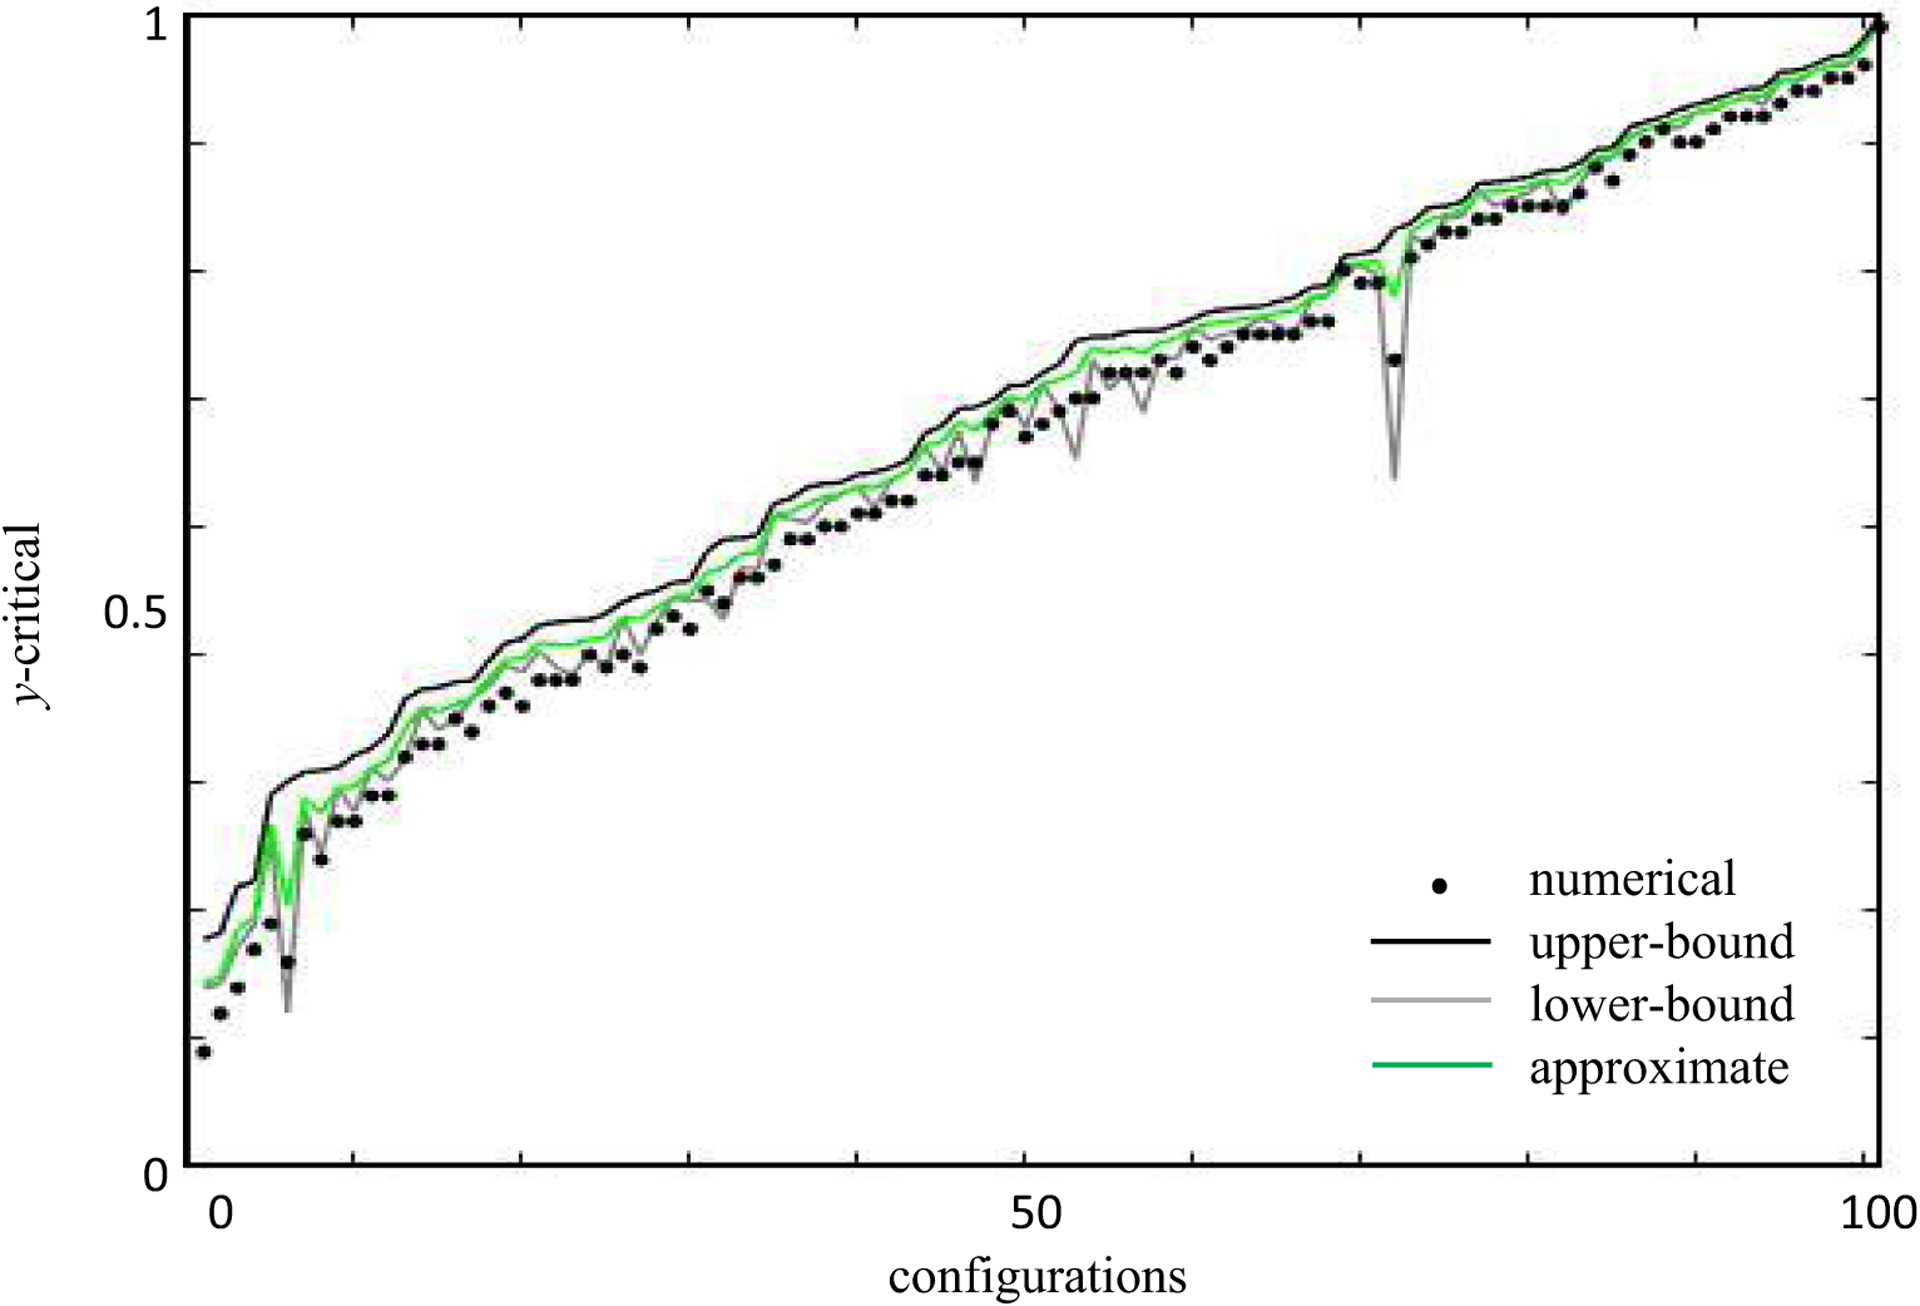
FIG. 11.

Testing bounds on y-critical for solutions with error. We show the same 102 random configurations of input-output activity as Fig. 8(b). The bold black, green, and gray curves represent the upper bound ycr,max, approximate ycr,appr, and lower bound y-critical ycr,min, values, respectively. The black dots correspond to the maximum value of y in our simulations that resulted in mixed signs for the synaptic weights under consideration.
