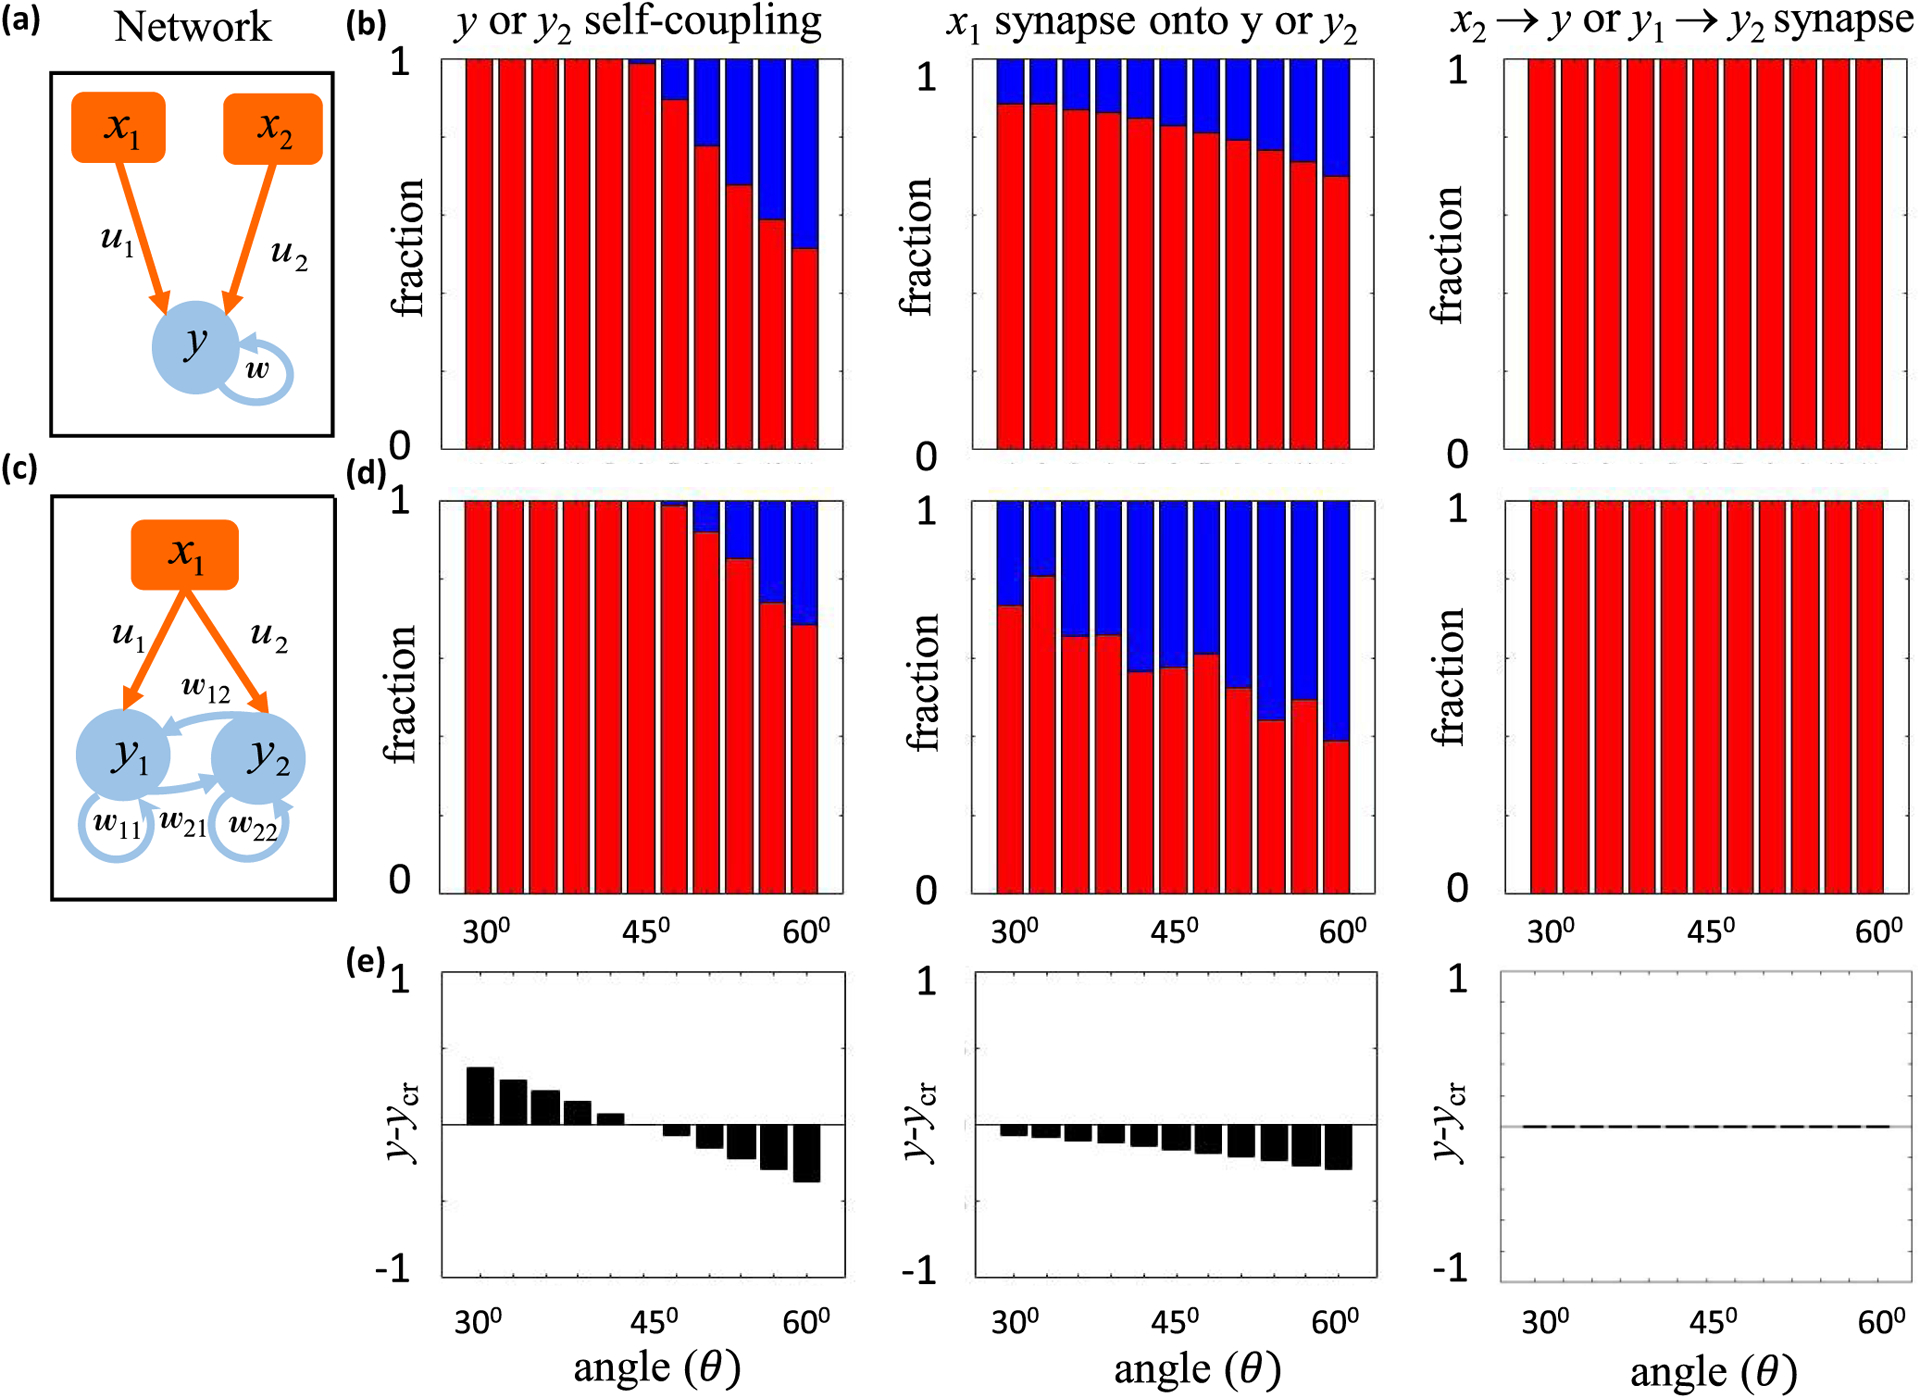
FIG. 12.

Comparing simulation and theoretical results in 𝒩 = 3 recurrent network. (a) A simple 𝒩 = 3 recurrent neural network with one driven and two input neurons. Note that the y1 neuron shown here maps onto the y3 neuron in Fig. 6(a) by interpreting the x1 and x2 neurons shown here as the x3 and y2 neurons shown in Fig. 6(a). (b) Bar graphs depicting the fraction of positive (red) and negative (blue) weights from the network depicted in panel (a). (c) Another 𝒩 = 3 recurrent neural network, this time with two driven and one input neuron. (d) Bar graphs depicting the fraction of positive (red) and negative (blue) weights from the network depicted in panel (c). (e) The black bars depict y − ycr for the corresponding synapses.
