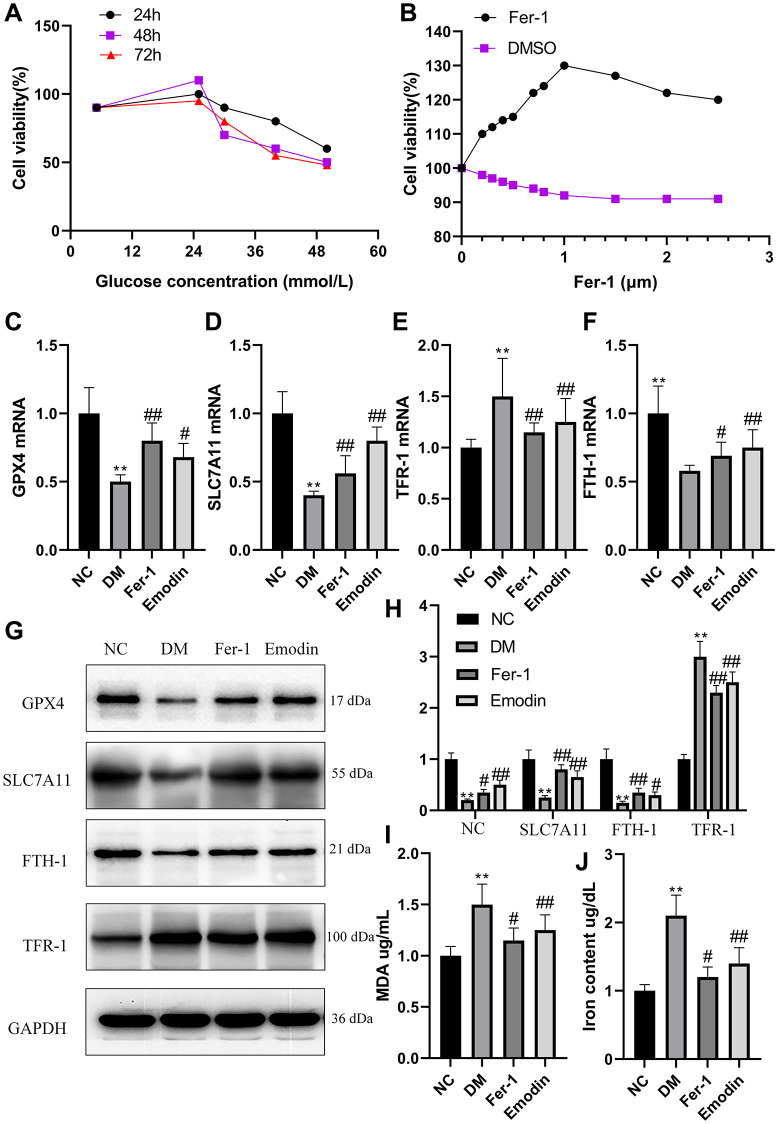
Figure 3.
High glucose induced ferroptosis in HK-2 cells. The HK-2 cells viability exposure to different concentration of glucose for different time (A). The HK-2 cells being exposed to culture medium containing 30 mmol/L glucose and treated with various dose of Fer-1 for a duration of 48 h (B). The mRNA expression of ferroptosis related indicators of HK-2 cells (C–F). The western blotting results (G) as well as semi-quantitative analysis (H) of ferroptosis related protein expression. The concentration of MDA (I) and iron (J) of HK-2 cells was measured. *P < 0.05, **P < 0.01 vs. normal group, #P < 0.05, ##P < 0.01 vs. model group.

