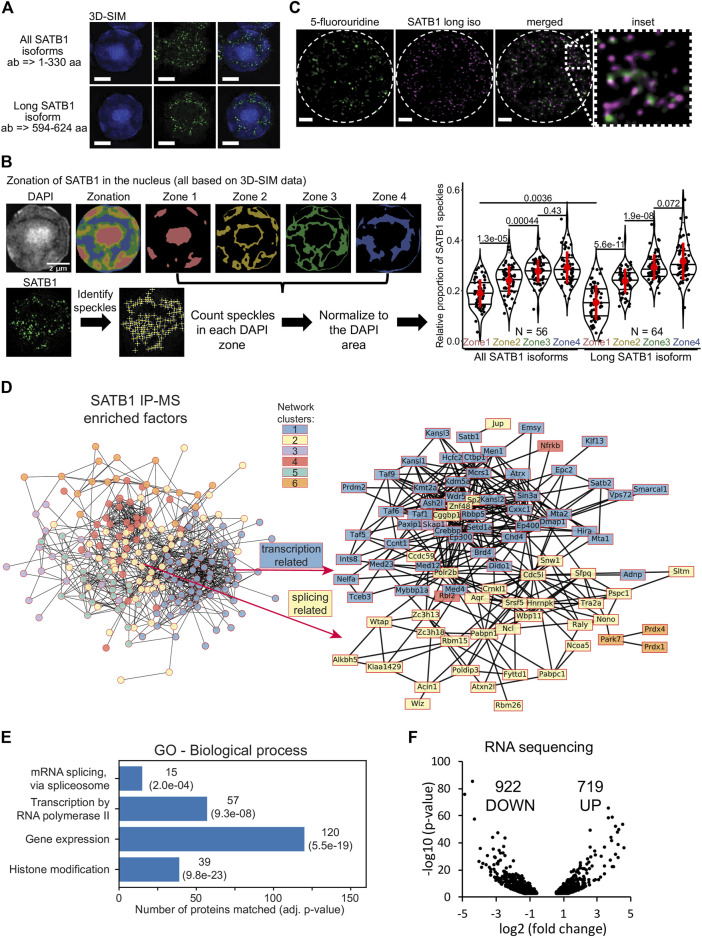
FIGURE 2.
SATB1 is localized in the active nuclear zone and sites of active transcription. (A) 3D-SIM immunofluorescence experiment utilizing two different SATB1 antibodies to visualize the nuclear localization pattern of the long isoform compared to all SATB1 isoforms. Representative of three biological replicates. Scale bar 2 μm. (B) Quantification of the 3D-SIM immunofluorescence images. Nuclei of primary murine thymocytes were categorized into four zones based on the intensity of DAPI staining and SATB1 speckles in each zone were counted. Images used represent a middle z-stack from the 3D-SIM experiments. The graph depicts the differences between long and all SATB1 isoforms’ zonal localization in nuclei of primary murine thymocytes. The horizontal lines inside violin plots represent the 25th, 50th and 75th percentiles. Red circles represent the mean ± s.d. p values by Wilcoxon rank sum test. (C) STED microscopy indicating that SATB1 speckles co-localize with sites of active transcription (60-min pulse 5-fluorouridine treatment). Data are representative of two biological replicates and conclusions were additionally validated by the 3D-SIM approach. Scale bar 1 µm. See also Supplementary Figure S3C. (D) STRING network of all significantly enriched SATB1-interacting proteins clustered using the k-means method (left). The full network, including protein names, is available in Supplementary Figure S4C. The blue cluster 1 and yellow cluster 2 were enriched for transcription and splicing-related factors, respectively. A more detailed network of selected transcription and splicing-related factors is provided (right). (E) Gene ontology enrichment analysis of SATB1-interacting proteins revealed factors involved in transcription and splicing. (F) Volcano plot from stranded-total-RNA-seq experiment displaying the differentially expressed genes (FDR < 0.05) in Satb1 cKO thymocytes.

