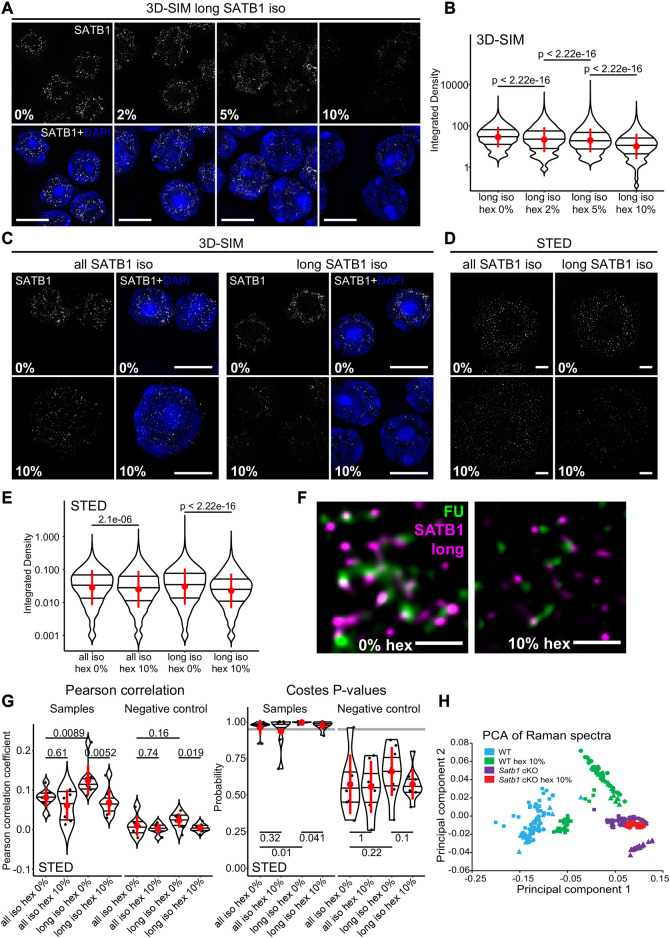
FIGURE 3.
SATB1 forms phase separated droplets in vivo. (A) 3D-SIM immunofluorescence microscopy on 1,6-hexanediol-treated thymocytes. Five minutes treatment with increasing concentrations of 1,6-hexanediol gradually solubilized long SATB1 isoform speckles. (B) Quantification of results in a showing a gradual decrease of SATB1 signal, indicating its sensitivity to 1,6-hexanediol treatment. (C) Comparison of immunofluorescence signal based on the antibody targeting all the SATB1 isoforms (Santa Cruz Biotechnology, sc-5990) and only the long isoform (Davids Biotechnology, custom-made) upon 1,6-hexanediol treatment, detected by 3D-SIM microscopy. (D) Immunofluorescence experiment as indicated in c but detected by STED microscopy. Scale bar 0.5 µm. (E) Quantification of results in d showing a more dramatic decrease of long SATB1 isoform signal upon 1,6-hexanediol treatment compared to the all SATB1 isoforms staining. (F) Co-localization of the long SATB1 isoform and fluorouridine-stained sites of active transcription (inset visualized in Figure 2C) and its deregulation upon 10% 1,6-hexanediol treatment detected by STED microscopy. Data are representative of two biological replicates and conclusions were additionally validated by the 3D-SIM approach. Scale bar 0.5 μm. (G) LEFT: Pearson correlation coefficients (PCC) derived from pixel-based co-localization analysis between long and/or all SATB1 isoforms and fluorouridine-stained sites of active transcription, with and without 10% 1,6-hexanediol treatment. RIGHT: the Costes p-values (Costes et al., 2004) derived from randomly shuffled chunks of analyzed images (100 randomizations). The grey line indicates a 0.95 level of significance. Images used for the analysis were generated by STED microscopy. Complete results of the co-localization analysis for both STED and 3D-SIM experiments, including Manders‘ coefficients are depicted in Supplementary Figures S5A–C. (H) Principal component analysis of Raman spectra from WT and Satb1 cKO thymocytes with and without 10% 1,6-hexanediol treatment. Each point represents measurements from an individual cell. For each condition, 2-5 biological replicates were used. See the extracted Raman spectra of the two main principal components that were used to cluster the data in Supplementary Figure S5D. In (B, E, G), the horizontal lines inside violin plots represent the 25th, 50th and 75th percentile. Red circles represent the mean ± s.d. p values by Wilcoxon rank sum test.

