FIGURE 5.
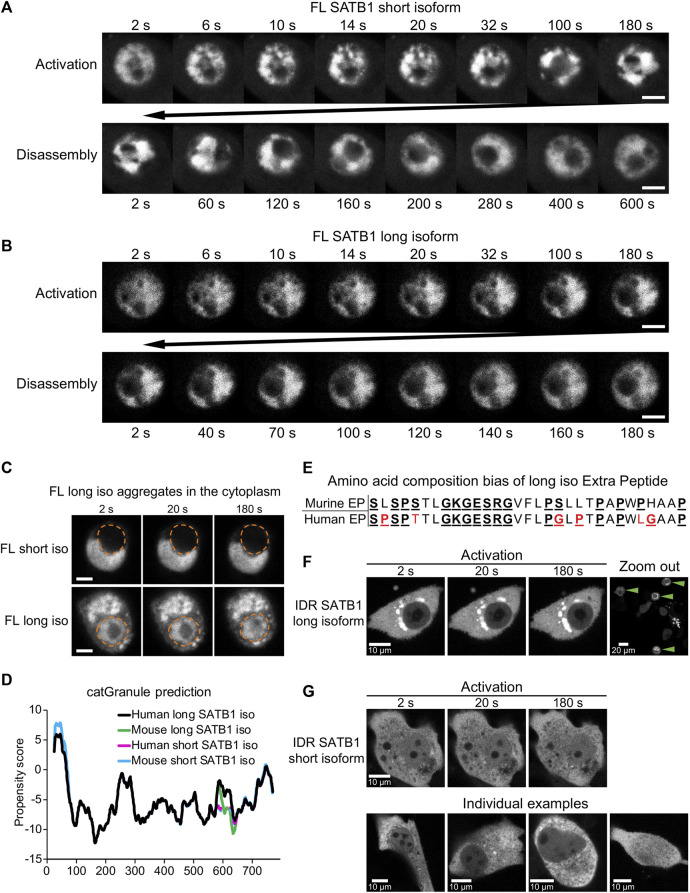
Discrete biophysical properties of SATB1 protein isoforms. (A) CRY2-mCherry constructs expressing full length short SATB1 isoform underwent reversible ultrastructural changes. Scale bar 5 μm. (B) The same experiment as in a but capturing CRY2-mCherry constructs expressing full length long SATB1 isoform. Scale bar 5 μm. (C) In a fraction of cells, the full-length SATB1 constructs were mislocalized outside the nucleus. For constructs with the long SATB1 isoform this triggered formation of irreversible aggregates. Scale bar 5 µm. For (A, B, C), the images are representative of two biological replicates. (D) Comparison of LLPS propensity predicted by the catGRANULE (Bolognesi et al., 2016) algorithm of human (Q01826-1 and Q01826-2, for short and long isoform, respectively; UniProtKB) and murine (Q60611 and E9PVB7, for short and long isoform, respectively; UniProtKB) SATB1 protein isoforms. Human long SATB1 isoform displays higher phase separation propensity compared to murine protein. (E) Both murine and human long SATB1 isoforms have an increased propensity to undergo phase separation compared to short isoforms due to the presence of the extra peptide with a compositional bias (enrichment in S, G, Q, P, E, K and R amino acids in the murine SATB1). Red letters indicate amino acid differences between murine and human peptide. (F) CRY2-mCherry constructs encompassing only the two SATB1 IDR regions and the poly-Q domain (as indicated in Figure 4A; Figure 1A), but not the NLS signal, displayed much higher rates of cytoplasmic aggregation for the long SATB1 isoform compared to the short isoform. Green arrows indicate cells with long SATB1 isoform aggregates. (G) The same experiment as in (F) but for the short SATB1 isoform IDR constructs.

