FIGURE 3.
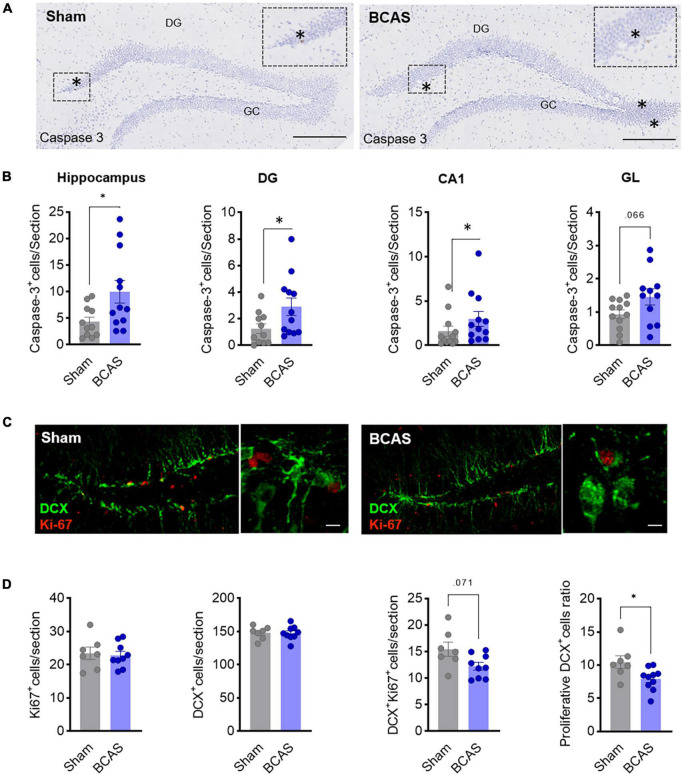
Mechanisms leading to impaired hippocampal neurogenesis. (A) Representative images of cleaved caspase-3 in hippocampus 3 months after surgery. Scale bar = 250 and 50 μm. (B) Cell death quantification in different hippocampal regions. Mann-Whitney test was used to compare the ranks (n = 12). (C) Representative images of DCX (green) and Ki-67 (red) co-staining in DG 1 month after surgery. Scale bars = 80 and 15 μm (n = 7–9). (D) Quantification of Ki67+, DCX+, and Ki67+/DCX+ cells and of the proliferation ratio of DCX+ cells. Two-tailed Mann-Whitney U-test was used to compare the ranks. *p < 0.05.

