
Fig. 4. Train stimulation in slices from AAV1-NPY/Y2 treated animals decreases glutamate release in neighbouring synapses through NPY-Y2 receptor activation.
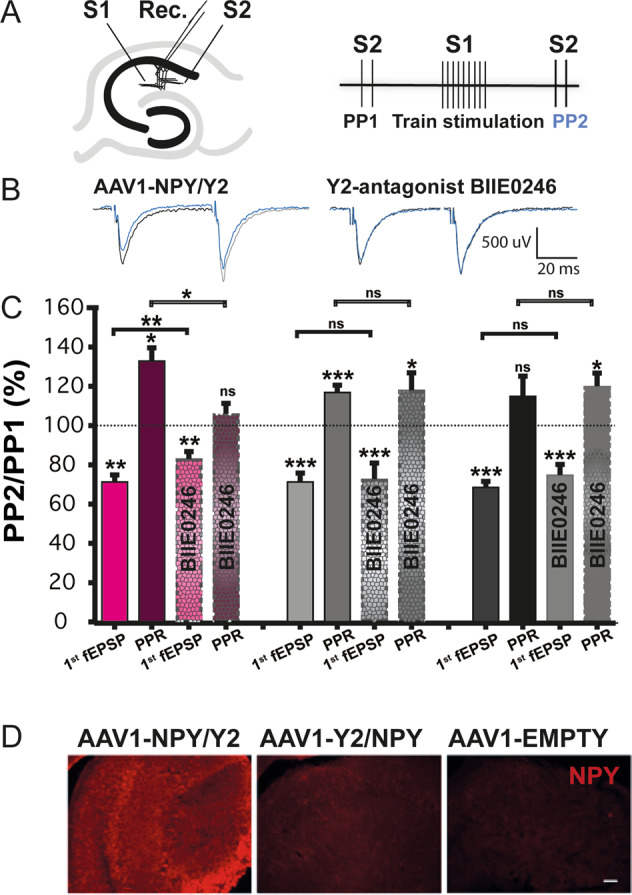
A Experimental setup, showing placement of stimulation (S1 and S2) and recording electrodes (Rec.) in the stratum radiatum, CA1 area of the acute hippocampal slice (left) and schematic depiction of the stimulation protocol (right). The effect of transgene NPY expression on excitatory neurotransmission was also examined by applying repetitive train stimulation (TS) with 100 Hz, 10 stimulations, in one group of presynaptic fibers/pathway (S1), preceded and followed at 500 ms interval by PP-stimulation (20 Hz) in a neighbouring, convergent but independent presynaptic pathway (S2). We compared the amplitude of the fEPSPS evoked by paired-pulse stimulation (PP) before (PP1) and after train stimulation (PP2, blue B). Example sweeps showing fEPSP evoked by S2 before (black sweep) and after TS-stimulation (blue sweep), showing a reduction in the first fEPSP and concomitant increase in PPR after TS-stimulation. Right) This reduction is smaller in the AAV1-NPY/Y2 treated animals after application of the Y2-receptor antagonist BIIE0246. C Bar graph showing average depression of fEPSP after TS-stimulation in AAV1-NPY/Y2 (n = 5), AAV1-Y2/NPY (n = 7), and AAV1-EMPTY (n = 7). The TS-induced depression of fEPSP is reduced after application of BIIE0246 in the AAV1-NPY/Y2 treatment-group (n = 5), but not in AAV1-Y2/NPY (n = 7) or AAV1-EMPTY (n = 7). AAV1-NPY/Y2 (left bars), AAV1-Y2/NPY (middle bars), and AAV1-EMPTY (right bars). D Examples of immunohistochemical staining for NPY after electrophysiology. Scalebar 100 μm, **P < 0.01, ***P < 0.001, Student’s paired t-test. Data is shown as mean ± SEM.