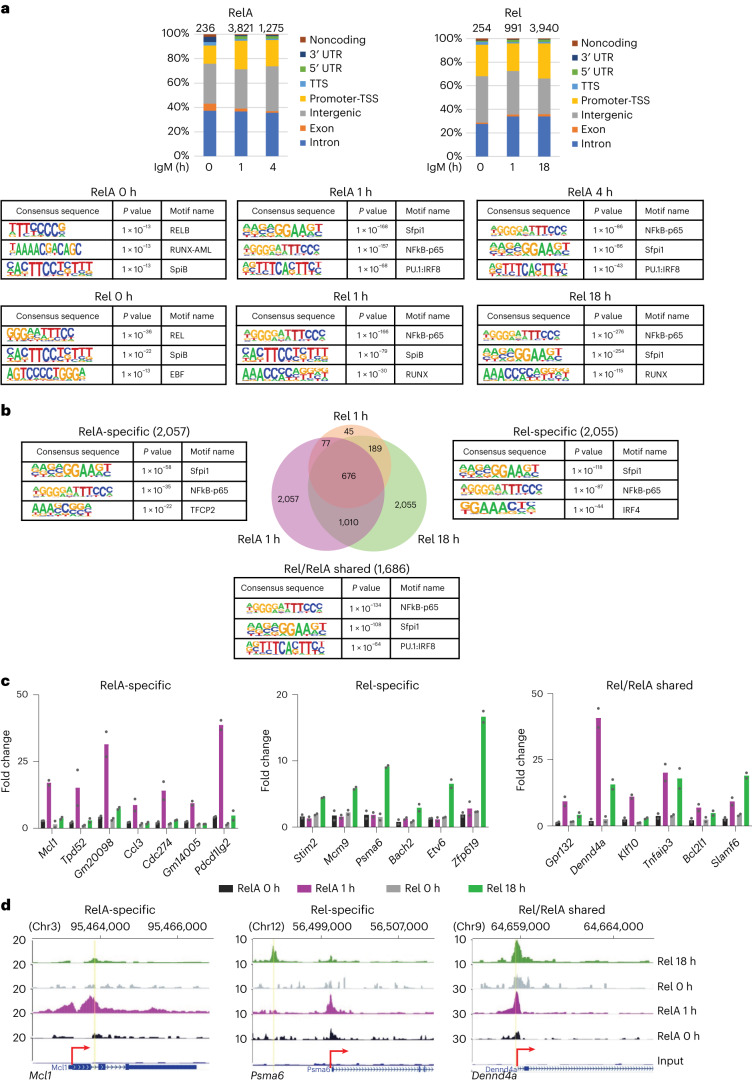
Fig. 1. Identification of RelA- and Rel-binding sites in BCR-activated B cells.
a–d, Splenic B cells from C57BL/6 mice were activated with anti-IgM (F(ab)′2) for 0, 1, 4 and 18 h. ChIP was carried out using anti-RelA and anti-Rel antibodies. Coprecipitated genomic DNA was used to generate libraries for sequencing. Data from two independent ChIP–seq experiments were processed as described in Methods. Results shown are for RelA- and Rel-binding sites that were common to both replicates with threshold peak scores as described in Methods. a, Genomic locations of RelA (left) and Rel (right) binding sites across multiple genomic regions, as annotated by HOMER. Total number of peaks at each activation time point are noted above the bars. Top substantial transcription factor binding motifs enriched within RelA peaks (top panels) and Rel peaks (lower panels) at different time points were identified using HOMER (see also Supplementary Fig. 1f,g). b, RelA and Rel ChIP–seq libraries were merged to identify shared and unique binding sites for each NF-κB subunit at each different time points (Venn diagram). Sequence motifs within RelA-specific, Rel-specific and RelA/Rel shared peaks are shown alongside (see also Supplementary Fig. 1k; a and b, Default statistical setting used to obtain P value by HOMER). c, Rel or RelA binding to select target genes was verified by ChIP–PCR. Data shown are the average of two additional ChIP experiments with cells activated for the indicated times; fold change = 2(CT(input)−CT(target))/2(CT(input)−CT(neg)). d, Representative browser tracks based on mm9 annotation of ChIP–seq profiles of genes that bind only RelA (Mcl1), only Rel (Psma6) or both Rel and RelA (Dennd4a). The y axis represents normalized reads per 10 million aligned reads (see also Supplementary Fig. 1l).

