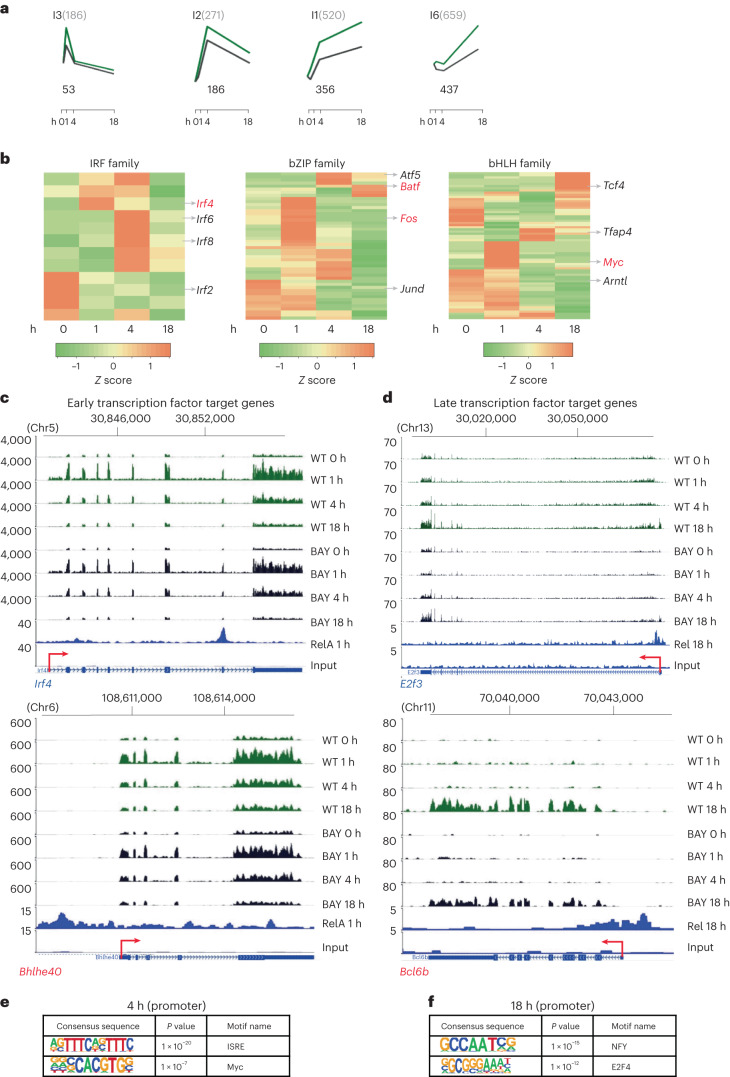
Fig. 6. NF-κB-activated transcriptional cascades.
a–f, Genes whose expression was altered by blocking both RelA and Rel induction with BAY 11-7082 but did not bind either RelA or Rel were inferred to be targets of NF-κB-induced transcription factors. a, Such genes were identified in four of the six k-means clusters in BAY-treated cells (Fig. 3d). Graphs show average row z score of fold change for genes in each cluster in activated WT B cells in the absence (green) or presence of BAY (black; from Fig. 3d). Activation times are noted on the x axis. Numbers on the top of each plotted kinetic pattern denote total number of genes in that cluster; numbers below each plot denote the numbers of genes that did not score for RelA or Rel binding at any activation time by ChIP–seq analyses. b, Heatmap profiles of three transcription factor gene families induced in response to B cell activation. Representative NF-κB target genes are indicated to the right of each panel (red font). See Extended Data Table 6 for a complete list of NF-κB target genes that encode transcription factors. c,d, Browser tracks of early (c) and late (d) transcription factor genes that were affected by BAY treatment. The top eight lines show RNA-seq tracks at different time points of anti-IgM treatment in the presence (BAY) or absence (WT) of BAY. The bottom two lines show RelA 1 h or Rel 18 h ChIP–seq and associated input tracks. e,f, DNA-binding motifs enriched in promoters (−400 to +100 bp relative to the transcription start site) of indirect NF-κB targets at 4 h (e) and 18 h (f). Motifs were identified using the known motifs setting in the HOMER algorithm. Significance was calculated using default statistical setting provided by HOMER.

