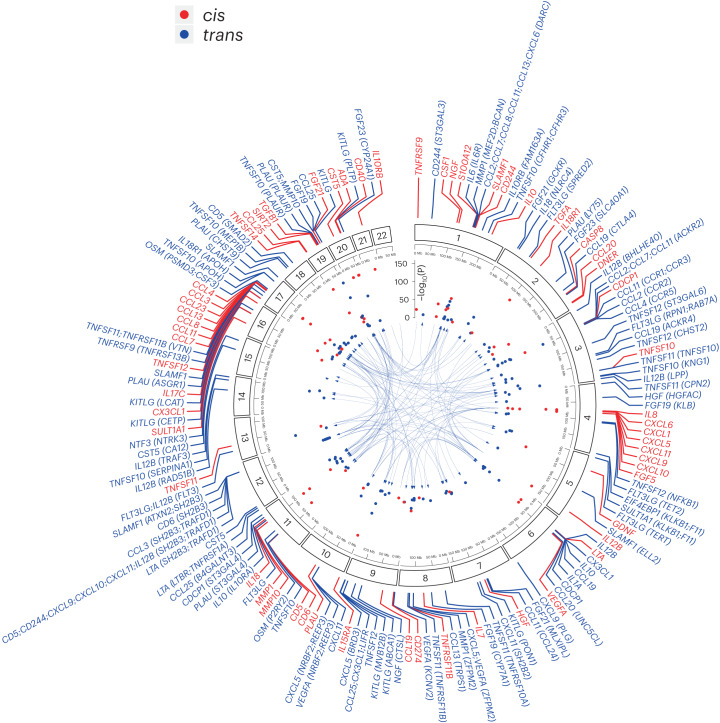
Fig. 1. Genomic map of genetic determinants of inflammation-related proteins.
Circos plot linking the location of pQTLs to the gene encoding their associated proteins. Labels for the cis-pQTLs (red) indicate the gene encoding the target protein. For the trans-pQTLs (blue), the gene symbols of the target proteins are indicated, along with the putative mediating gene(s) at the trans-pQTLs in brackets where applicable. The −log10(P) values are capped at 150 for readability. Two-sided P values are from meta-analysis of linear regression estimates.

