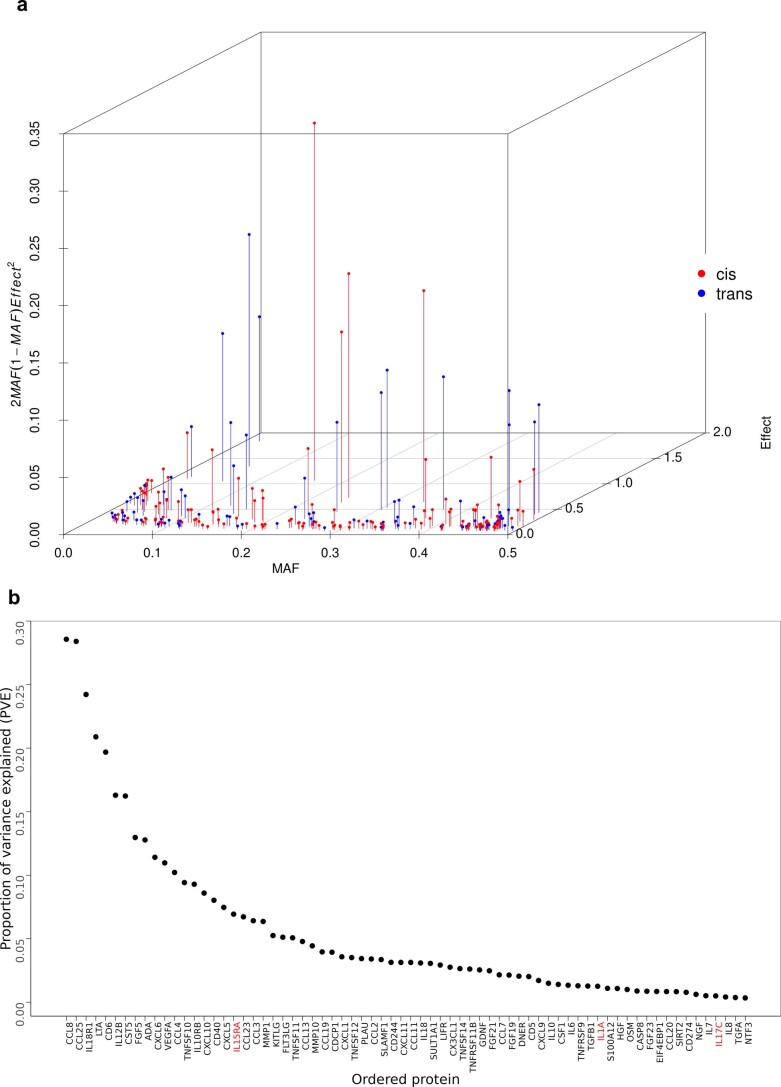
Extended Data Fig. 4. Genetic architecture of circulating inflammation-related proteins.
a) Relationship between minor allele frequency (MAF), pQTL effect size and proportion of variance explained (2MAF(1-MAF)Effect2), for 227 conditionally independent pQTLs (red=cis, blue=trans). b) Proportion of variance explained (PVE) by the conditionally independent variants associated with each protein. Proteins are annotated using the gene symbol of their encoding genes. Protein names are coloured in red if over 80% of samples have levels below the lower limit of detection in the INTERVAL dataset.

