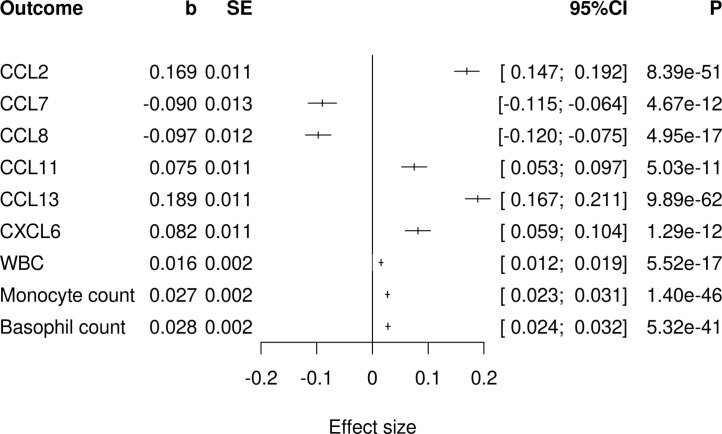
Extended Data Fig. 5. Chemokine trans-pQTL hotspot.
Forest plot showing the associations for the pleiotropic trans-pQTL at rs12075 (GRCh37, 1:158175353-160525679) with plasma levels of chemokines and blood cell counts. Center of bar = effect size estimate, whiskers = 95% confidence interval (cI). WBC = white blood cell count. P = p-value, b= beta (effect size). SE = standard error. Blood cell association data from Chen et al.20. P-values from linear regression.

