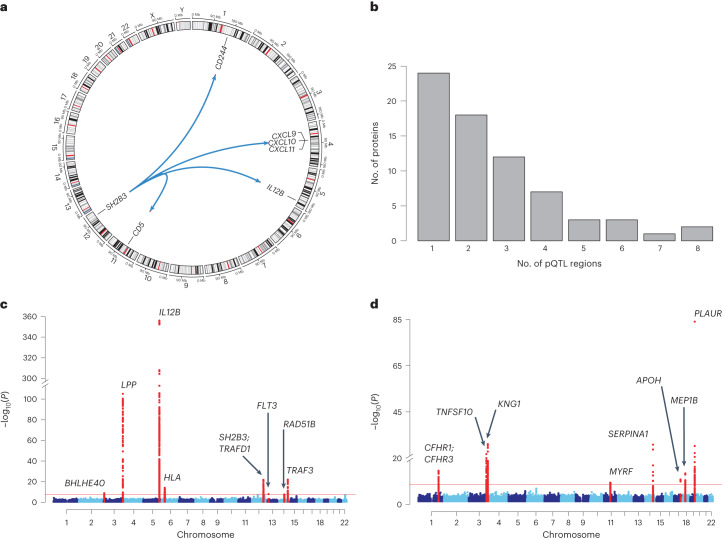
Fig. 2. Genetic architecture of 91 inflammation-related proteins.
a, Circos plot showing the trans-pQTL ‘hotspot’ at the SH2B3 locus on chromosome 12, associated with six proteins. b, Distribution of the number of identified pQTLs per protein. The HLA was treated as a single region. c,d, Manhattan plots showing genetic associations with plasma abundance of IL-12B (c) and TNFSF10 (TRAIL) (d). The horizontal red line indicates statistical significance (P = 5 × 10⁻¹⁰). Two-sided P values are from meta-analysis of linear regression estimates. The nearest genes in the region of pQTL signals are annotated.

