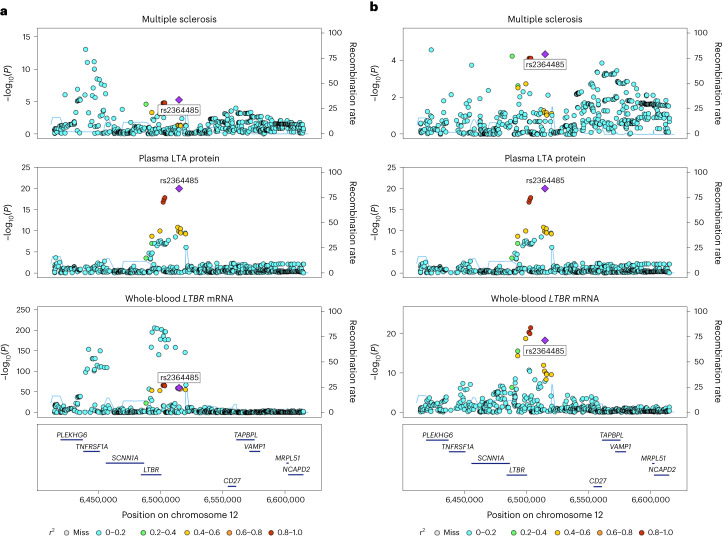
Fig. 4. The LTBR–LTA axis in the etiology of multiple sclerosis.
a,b, Unconditioned (a) and conditioned (b) regional association plots at the TNFRSF1A-LTBR locus (rs2364485 ± 100 kb) for multiple sclerosis (top), plasma LTA protein levels (middle) and LTBR mRNA expression in whole blood from eQTLGen14 (bottom). Multiple sclerosis associations were conditioned on rs1800693 (the strongest disease signal in the region). LTBR mRNA expression levels were conditioned on the following independent eQTLs: rs3759322, rs1800692, rs2228576, rs10849448, rs2364480 and rs12319859. The purple diamond shows the sentinel pQTL variant. Other variants are colored by LD to the sentinel pQTL. Two-sided P values are from meta-analysis of linear regression estimates.

