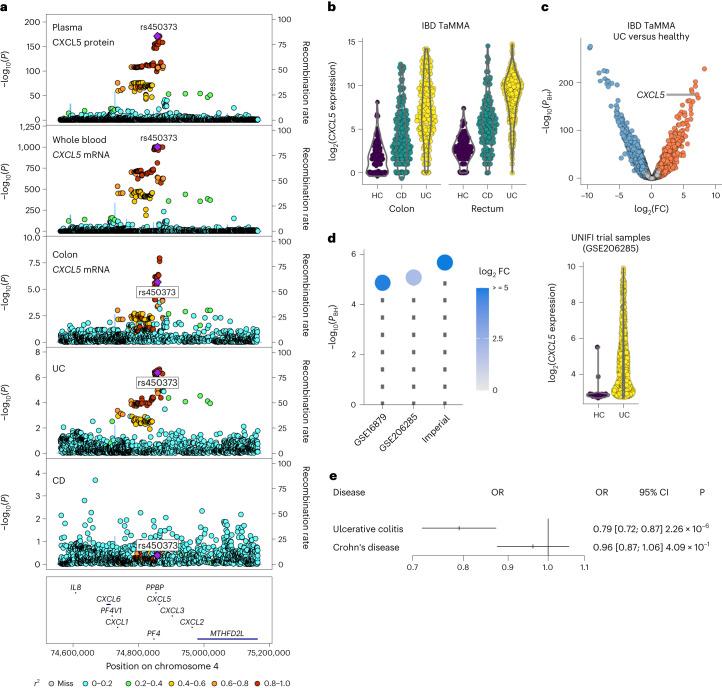
Fig. 6. CXCL5 in UC pathogenesis.
a, Genetic associations in the CXCL5 gene region. From top to bottom: plasma CXCL5 pQTL (n = 14,824 participants), whole-blood eQTL (from eQTLGen data, n = 31,684 participants), colon tissue eQTL (GTEx, n = 368 individuals), UC (cases = 12,366, controls = 33,609) and CD (cases = 12,194, controls = 28,072) (from the IBD Genetics Consortium51). The purple diamond shows the sentinel pQTL variant. Other variants are colored by LD to the sentinel pQTL. P values are from linear regression for QTLs and logistic regression for case-control GWAS. b, Violin plots showing CXCL5 expression in gut mucosal samples from patients with UC or CD and healthy controls (HC) in IBD TaMMA. c, Volcano plot showing differential expression analysis comparing colonic tissue from UC with HCs (IBD TaMMA). Red and blue points represent significantly (5% FDR) up- and downregulated transcripts, respectively. Gray indicates nonsignificant. PBH, Benjamini–Hochberg adjusted P values. P values in c and d are from Wald tests (two sided). d, Replication. Left, CXCL5 differential expression in colon biopsies in UC versus HCs from transcriptome-wide analysis across three cohorts. The GSE numbers are GEO accession numbers. Imperial is the Imperial UC cohort. Each lollipop represents a separate cohort: GSE16879 (n = 24 UC patients versus n = 6 HCs); GSE206285 (n = 550 UC patients versus n = 18 HCs); and Imperial (n = 16 UC versus 6 HCs). The circle color indicates the log2(FC) in CXCL5 expression between UC and HCs. Right, CXCL5 expression in colon biopsies sampled at baseline during the UNIFI clinical trial. Each point represents an individual. e, Forest plot showing MR analysis for UC and CD. OR is the odds ratio for the risk associated with a 1 s.d. increase in the level of the protein. The center of the bar is the point estimate for OR and the whiskers are the 95% CIs.

