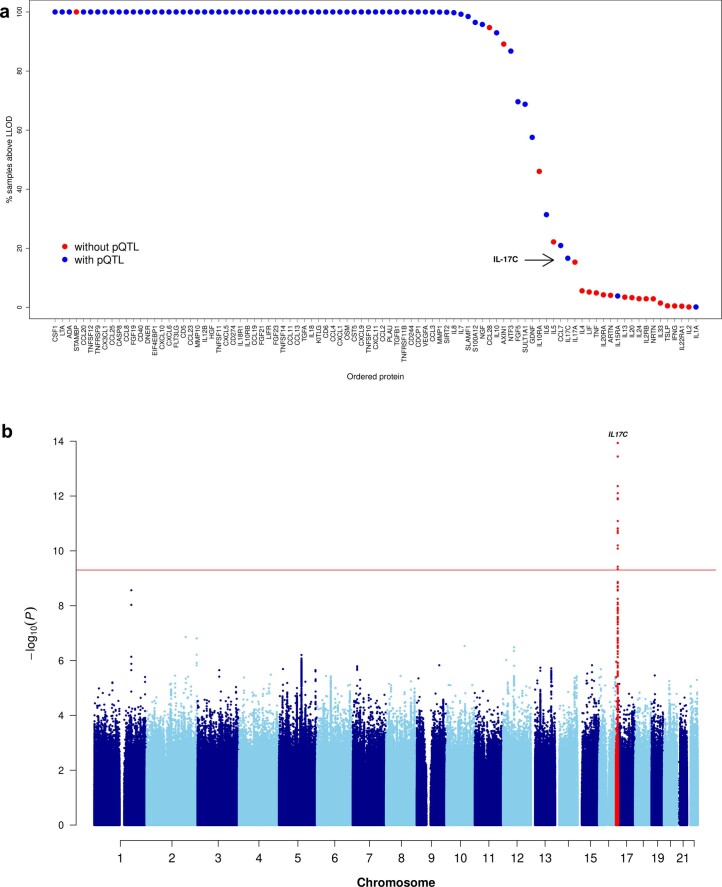
Extended Data Fig. 2. Plasma protein abundance and pQTL detection.
a) Proteins with low abundance are more likely to have no detectable pQTL. Y-axis: percentage of samples above lower limit of detection for each protein, calculated using the INTERVAL data (n = 4,896) for which we had individual-level protein data available. Blue and red points indicate presence or absence of at least 1 significant pQTL in the GWAS meta-analysis, respectively. b) Manhattan plot for genetic associations with plasma IL17C, where the red horizontal line indicates the statistical significance threshold (5 × 10⁻¹⁰). P-values from linear regression.

