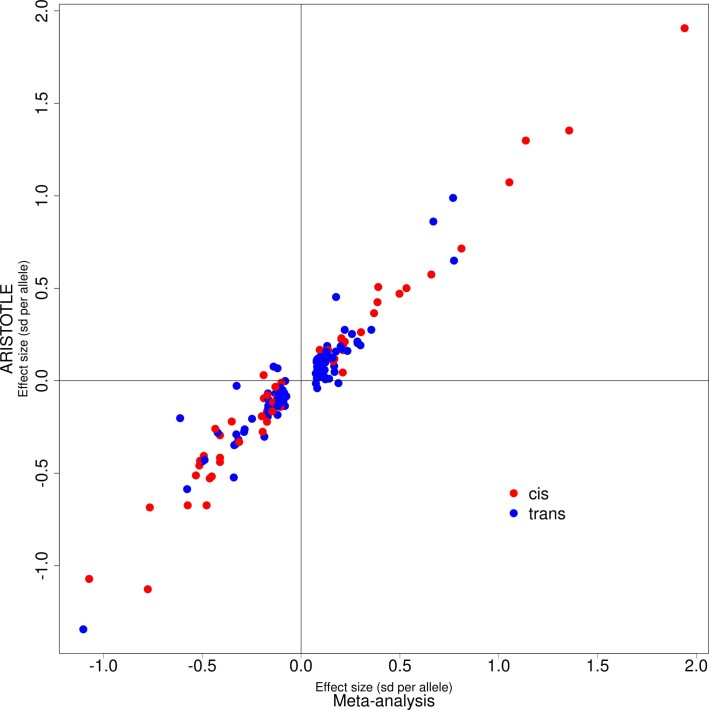
Extended Data Fig. 3. pQTL replication in the ARISTOTLE cohort.
Comparison of effect sizes between pQTLs from the discovery pQTL meta-analysis (n = 14,824) and the ARISTOTLE cohort (n = 1,585). Each point represents a genetic variant that was a significant pQTL in the discovery meta-analysis. Effect size = standard deviation (sd) increase in protein per allele. 174 of 180 genetic variants were available for testing in the ARISTOTLE data. Red= cis, Blue= trans.

