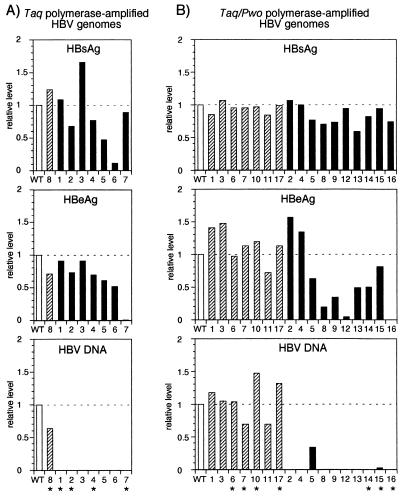
FIG. 3.
Levels of HBsAg, HBeAg, and intracellular replicative HBV DNA produced by HBV genomes amplified with Taq polymerase (A) or Taq-Pwo polymerase mixture (B). HBsAg and HBeAg were measured in the cell culture supernatant by enzyme immunoassays (Abbott), and the HBV DNA signals shown in Fig. 2 were quantified with TINA software (Raytest). The designation of the clones is the same as in Fig. 2. The values are given relative to that of the nonamplified wild-type genome (WT; open bar). Genomes which replicate at about wild-type genome level (range, WT/1.5 to WT × 1.5) are grouped (shaded bars), and those which were partially or completely sequenced are marked with an asterisk. Solid bars represent defective genomes.

