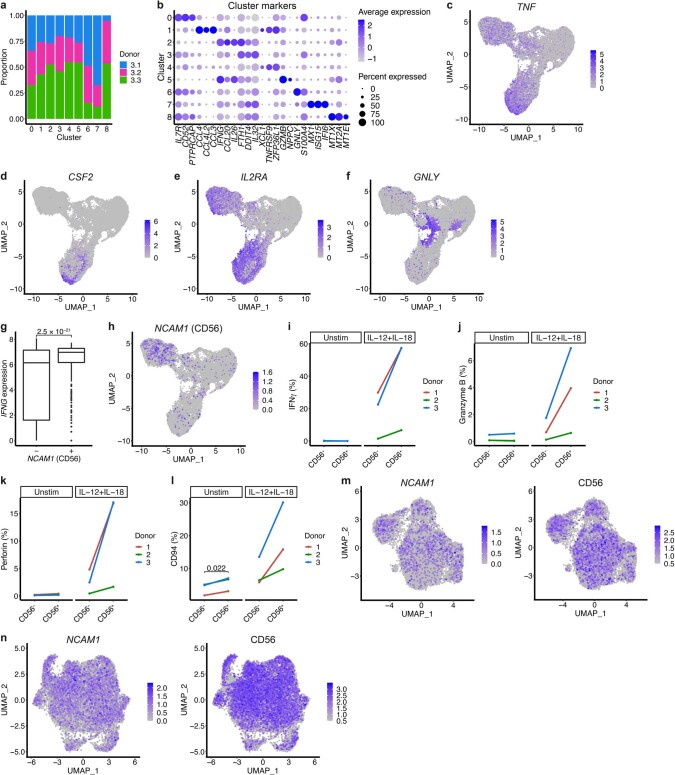
Extended Data Fig. 5. Gene and protein expression by TCR- and cytokine-stimulated MAIT cells.
a, Proportion of cells from each donor (n = 3) in each cluster (unstimulated, TCR-stimulated and cytokine-stimulated MAIT cells combined). b, Expression of the top three marker genes per cluster. Dot color indicates the level of gene expression and dot size indicates the percentage of cells expressing the gene. c-f, UMAPs colored by expression of TNF (c), CSF2 (d), IL2RA (e) and GNLY (f). g, Expression of IFNG in cytokine-stimulated MAIT cells negative (n = 11,122 cells) and positive (n = 387 cells; log-transformed normalized expression >0) for the expression of NCAM1 (CD56). Boxes span the 25th–75th percentiles, the midline denotes the median and whiskers extend to ±1.5 × IQR. Points indicate outliers. Two-sample Wilcoxon rank-sum test. h, UMAP colored by expression of NCAM1 (CD56). i-l, Percentage of sorted CD56− and CD56+ MAIT cells expressing IFNγ (i), granzyme B (j), perforin (k) and CD94 (l) when left unstimulated or stimulated with IL-12 + IL-18 for 20 h (as measured by flow cytometry). n = 3 donors. Two-sided paired t-test between CD56- and CD56+ cells in both conditions (nonsignificant results omitted). m,n, CD56 gene (left) and protein (right) expression in blood (m) and liver (n) MAIT cells. Protein expression measured in Exp 2 only.

