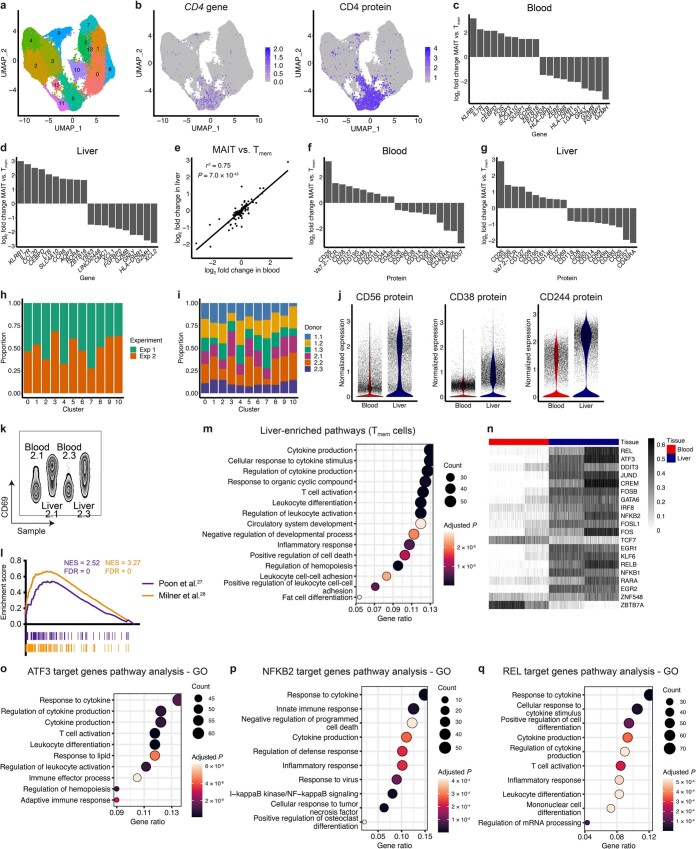
Extended Data Fig. 1. MAIT and Tmem cells, and blood and liver MAIT cells, exhibit distinct phenotypes and transcriptomes.
a, UMAP of blood and liver MAIT cells and conventional memory T (Tmem) cells colored by the 14 identified clusters. n = 89,456 cells from 12 donors (11 blood, 7 liver). b, UMAPs of blood and liver MAIT and Tmem cells colored by CD4 gene (left) and protein (right) expression. c,d, Bar plots showing the log2 fold change in expression of the top ten genes upregulated in MAIT cells compared with Tmem cells, and vice versa, in the blood (c) and liver (d). e, Pearson’s correlation between the log2 fold change in protein expression between MAIT and Tmem cells in the blood, and MAIT and Tmem cells in the liver. f,g, Bar plots showing the log2 fold change in expression of the top ten proteins upregulated in MAIT cells compared with Tmem cells, and vice versa, in the blood (f) and liver (g). h,i, Proportion of cells in each cluster (analysis of MAIT cells from six matched blood-liver donors) from Exp 1 and Exp 2 (h) and from each donor (i). j, Expression of CD56, CD38 and CD244 (2B4) proteins in blood and liver MAIT cells. k, Flow cytometry plot showing CD69 expression on blood and liver MAIT cells from two representative donors. l, Gene set enrichment analysis of liver compared with blood Tmem cells using published human and mouse tissue-resident memory T cell gene signatures. NES, normalized enrichment score. m, Over-representation analysis on the genes significantly upregulated in liver Tmem cells compared with blood Tmem cells. Top 15 gene ontology (GO) terms and associated Benjamini–Hochberg adjusted P values are shown. n, Heatmap showing activity (row-scaled AUCell scores) of the 20 most differentially active regulons (largest difference in average AUCell score) between matched blood and liver MAIT cells in Exp 2. n = 3 donors. o-q, Over-representation analysis on predicted ATF3 (o), NFKB2 (p) and REL (q) target genes. Top ten GO terms and associated Benjamini–Hochberg adjusted P values are shown.

