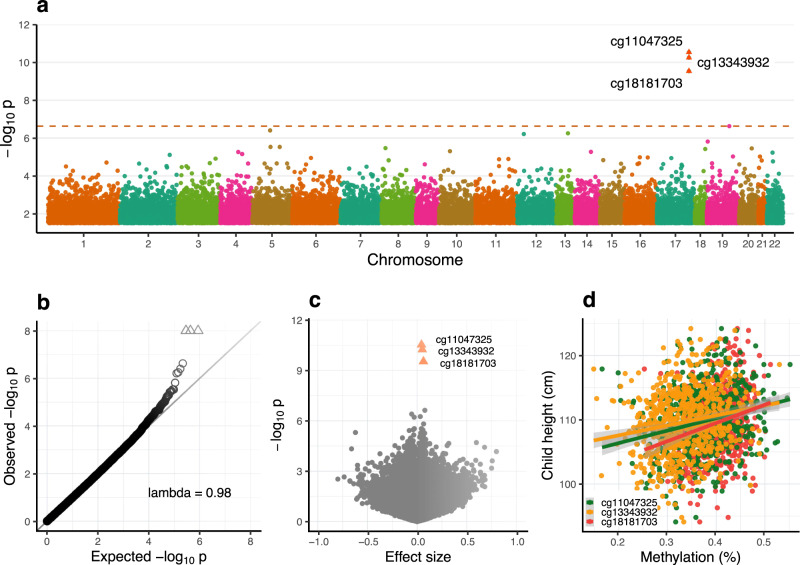
Fig. 2. Discovery epigenome-wide association analysis of height in children from the MMNP cohort.
a Manhattan plot showing epigenome-wide DNA methylation association results with respect to childhood height. Multiple linear regression models were used for the EWAS analysis. The dashed horizontal line represents Benjamini–Hochberg false discovery rate (FDR) = 0.05; P = 2.4 × 10⁻⁷). Arrowheads represent the three CpGs in SOCS3 passing the FDR < 5% threshold. b Quantile–Quantile (Q–Q) plot for genomic inflation in P values. Lambda represents the genomic inflation factor. c Volcano plot showing effect sizes and P values. Arrowheads represent the FDR-significant CpGs in SOCS3. d Scatter plot showing effect sizes of significant CpGs. For each CpG, the gray-shaded area around the regression lines indicate 95% confidence interval for the estimated coefficient. EWAS Epigenome-wide association study.

