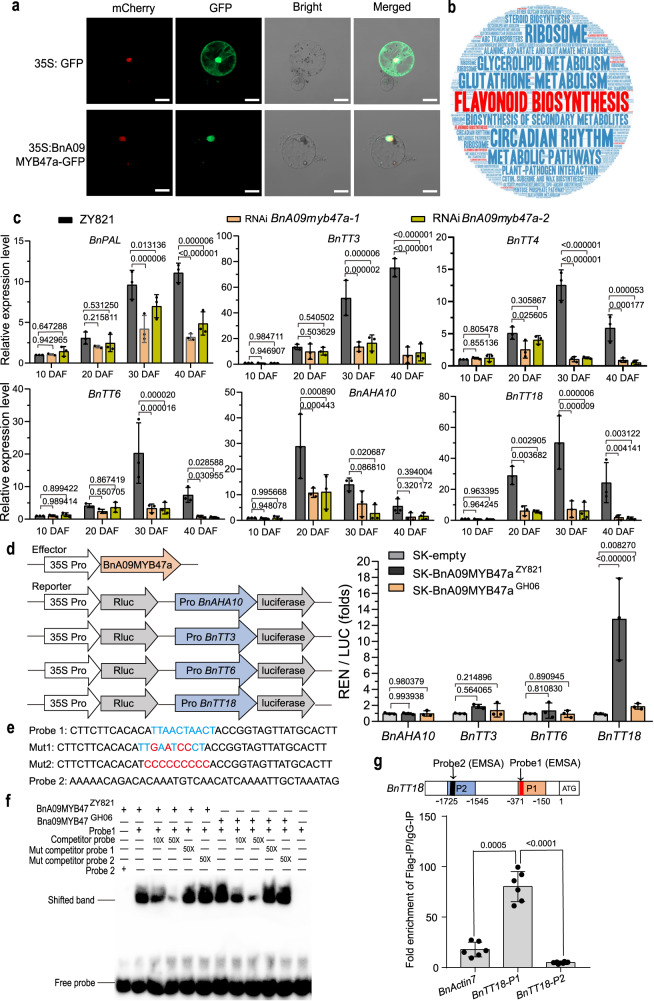
Fig. 5. BnA09MYB47a directly regulates flavonoid pathway genes.
a Subcellular localization of free GFP and BnA09MYB47a-GFP fusion proteins in B. napu protoplasts. Scale bars, 20 μm. Assays were performed three times using protoplasts from three independent experiments. b Word cloud of top 20 significant metabolic pathways (q-value ≤ 0.05) for the DEGs between control (ZY821) and RNAi samples. The figure was generated using https://wordart.com/. c The relative expression of BnPAL, BnTT3, BnTT4, BnTT6, BnAHA10, and BnTT18 in developing seed coats of RNAi transgenic plants compared to those of ZY821, as determined by RT-qPCR. Relative gene expression was normalized to the expression values in ZY821 at 10 days after flowering (DAF). P values were calculated using multiple t tests without adjustments. Data are presented as average ± SEM of 3 biological repeats. d Dual-luciferase reporter assay showing that BnA09MYB47aZY821 rather than BnA09MYB47aGH06 regulates BnTT18 promoter activity. Values are normalized to the level of the blank effector and presented as mean ± SEM from three biological repeats. P values were calculated using multiple t tests without adjustments. e Probes used in the electrophoretic mobility shift assay (EMSA). f EMSA was used to assess the binding of BnA09MYB47aZY821 and BnA09MYB47aGH06 to the promoter element in BnTT18. g BnTT18 is a downstream target of BnA09MYB47a. Upper panel, diagram of the BnTT18 promoter fragments (P1 and P2) used in chromatin immunoprecipitation-quantitative PCR (ChIP-qPCR). The red and black boxes in P1 and P2, respectively, indicate the detection probes used in the EMSA, as shown in (e). Lower panel, BnA09MYB47a-mediated ChIP-qPCR enrichment. Chromatin prepared from transgenic leaves using an anti-Flag antibody (IP) was detected by qPCR with IgG as the control. BnActin7 and BnTT18-P2 were used as nonspecific targets. Data are presented as means ± SD (n = 6). P values were calculated using the two-tailed Student’s t test. Source data are provided as a Source Data file.

