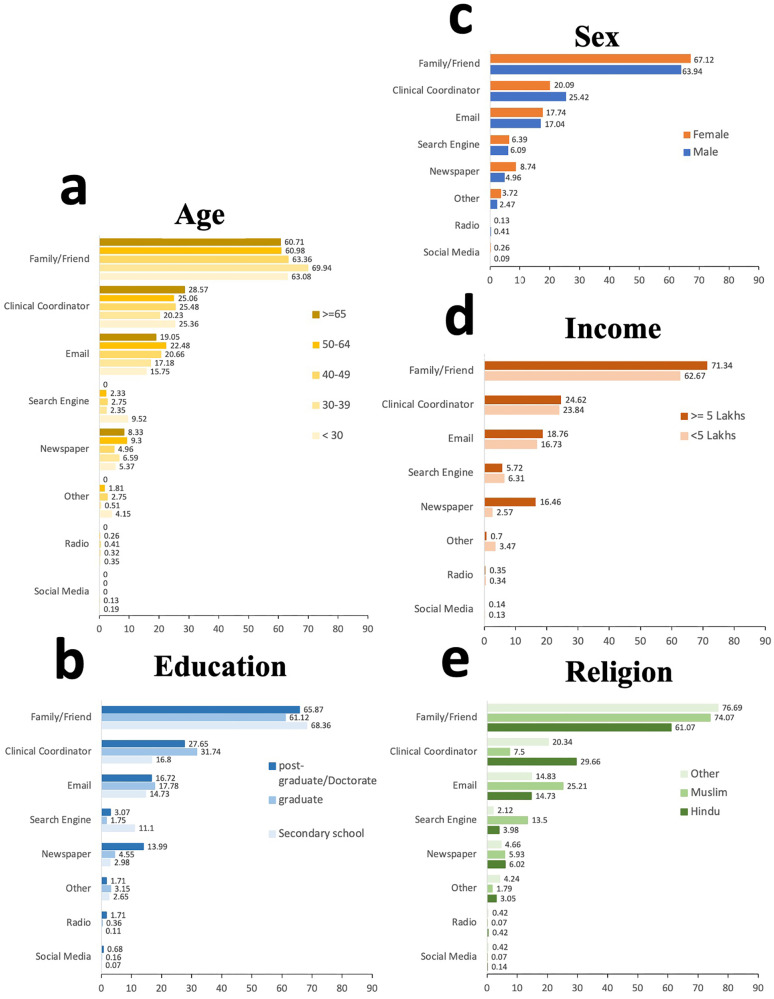
Fig. 4. Participants by study motivation and demographic groups.
Frequencies of study motivation (helping family and friends, helping the country, protecting my health, advancing research, and access to medical advice through reliable sources such as NIH) across demographic groups stratified by age (a), education (b), sex (c), Income (d), and religion (e). Sample size: n = 5905 participants were used to derive the percentages. Sample size: 5905 participants were used to derive the percentages. In a, the shades of yellow represent different age groups, while in b, different shades of blue signify educational groups. The colors orange and blue in c indicate the female and male sexes, respectively. In d, different shades of orange are used to denote income groups, and in e, various shades of green represent religious groups.

