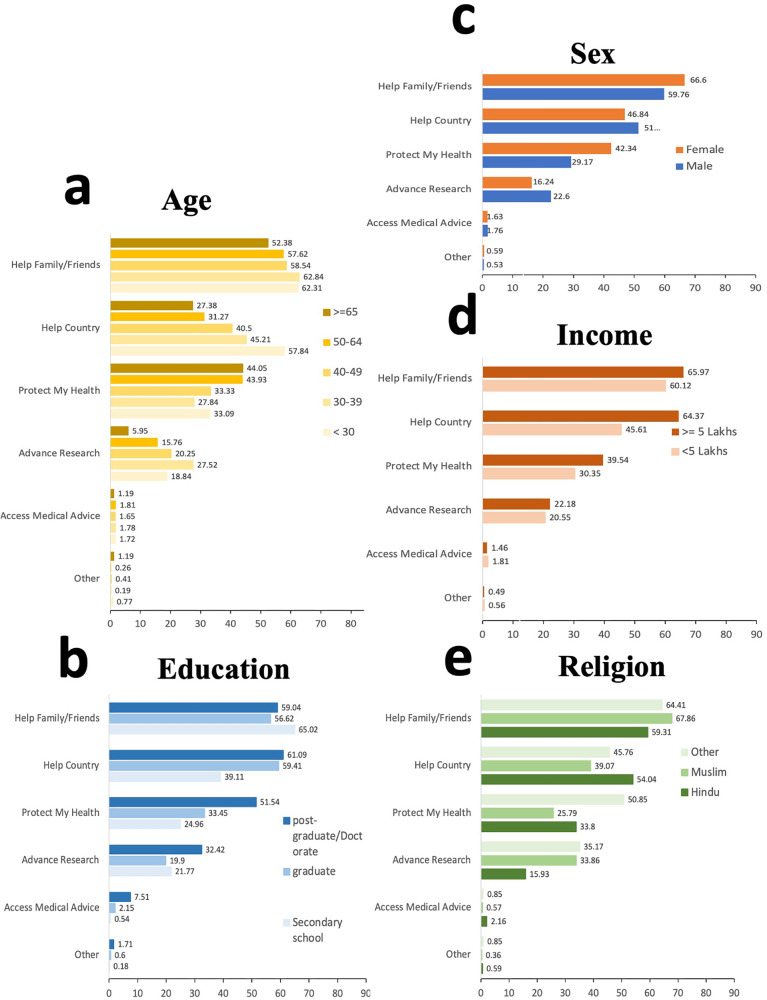
Fig. 5. Participants by recruitment methods and demographic groups.
Frequencies of recruitment methods (referral by family or friends, referral by the clinical coordinator, newsletter/email, pamphlet/newspaper, search engine, radio, social media, others) across demographic groups stratified by age (a), education (b), sex (c), Income (d), and religion (e). Sample size: n = 5905 participants were used to derive the percentages. In a, the shades of yellow represent different age groups, while in b, various shades of blue indicate educational groups. The colors orange and blue in c signify the female and male sexes, respectively. In d, different shades of orange are used to depict income groups, and in e, various shades of green represent religious groups.

