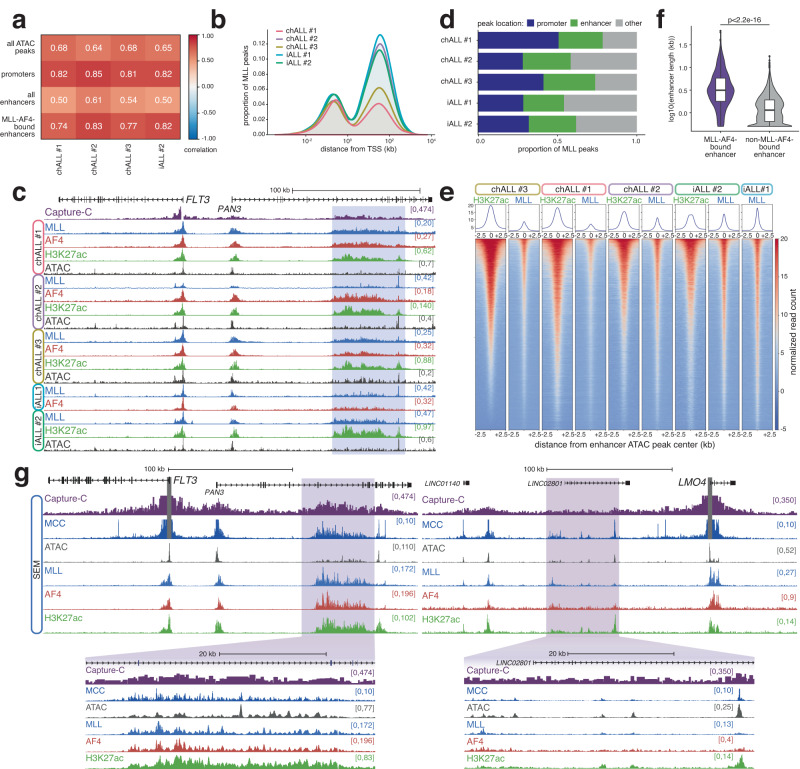
Fig. 1. MLL-AF4 binding at enhancers is a common feature of cell lines and primary material.
a Correlation of H3K27ac and MLL ChIP-seq/TOPmentation signal at all ATAC peaks, promoter ATAC peaks, all enhancers and MLL-AF4-bound enhancers for the indicated patient samples. b Distribution of MLL peaks in five MLL-AF4 patient samples relative to the nearest TSS. c ChIP-seq/TOPmentation for MLL, AF4 and H3K27ac, and ATAC-seq at the FLT3/PAN3 locus in the indicated patient samples. Capture-C from the FLT3 TSS is shown for SEM cells. The MLL-AF4-bound enhancer within PAN3 is highlighted in blue. d Proportion of MLL peaks associated with promoters and enhancers in each patient sample. e Heatmap of H3K27ac ChIP-seq and MLL ChIP-seq/TOPmentation signal in the indicated patient samples at enhancer ATAC-seq peaks. f Distribution of the length of enhancers bound (n = 807) or not bound (n = 8948) by MLL-AF4 in SEM cells. p-value indicates the statistical significance of the difference in enhancer length (two-sided Wilcoxon rank sum test), p < 2.2 × 10⁻¹⁶. Midline shows median, with upper and lower hinges showing the 25th and 75th percentile, respectively. Upper and lower hinges extend to the largest and smallest datapoints within 1.5 times the interquartile range of either hinge. g Capture-C, Micro-Capture-C (MCC), ATAC-seq and ChIP-seq for MLL, AF4 and H3K27ac at the FLT3 and LMO4 loci in SEM cells. Enhancer regions are highlighted in purple. Capture-C and MCC traces scaled to emphasize distal interactions.

