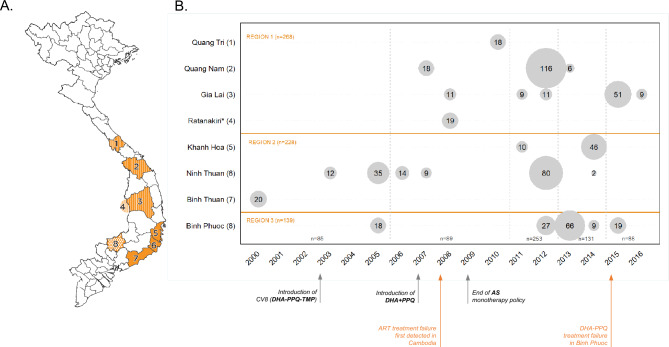
Figure 1.
Origin of the samples. (A) Map of Vietnam with the location of administrative provinces where samples were collected. Three main geographical regions were defined for analytical purposes based on geographical location and malaria epidemiology criteria (‘Region 1’, stripes; ‘Region 2’, plain orange; ‘Region 3’, dots). Note that Ratanakiri is an administrative province of Cambodia. (B) Detail on sample size per location and year. Circles are proportional to sample size. Time groups used for analysis are indicated by vertical dashed lines. The bottom panel indicates relevant events regarding antimalarial treatment policy in Vietnam and Greater Mekong Subregion. This map was developed for the purpose of this article using QGIS 3.10.

